Generic selectors
Exact matches only
Search in title
Search in content
Post Type Selectors

Popular stocks

Crypto

CFD

Currencies

Support

Gold

OIL – Technical Analysis – 4h

September 26, 2025 16:01

Quick Summary

The Crude Oil Futures chart presents a strong bullish momentum.

Recent breakout above key resistance levels is supported by increasing volume.

MACD indicators are also favorable.

Candlestick Analysis

Recent candles show a strong bullish trend with long green bodies, indicating strong buying pressure.

A potential bullish breakout is observed at the resistance level around 66.00.

The chart shows a bullish trend in the short term.

MACD Analysis

The MACD line (blue) is above the Signal line (red), indicating a bullish crossover and momentum.

Positive and expanding histogram bars suggest increasing upward momentum.

There is no visible divergence; MACD aligns with the price trend.

Volume Analysis

There is an increase in volume accompanying the recent price breakout, confirming the strength of the move.

The volume spike suggests potential institutional participation.

The increase in volume supports the bullish breakout.

Support & Resistance

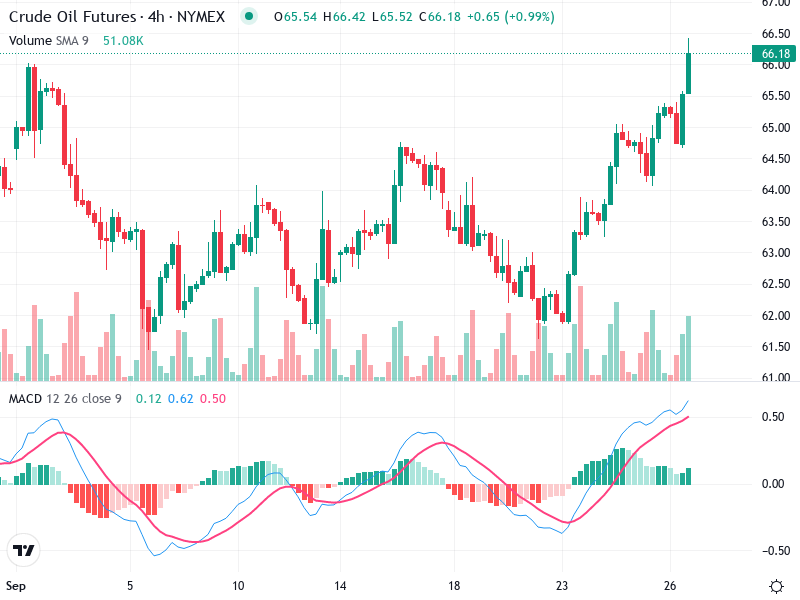
Support is around 62.00 where previous lows were established.

Resistance is around 66.00, though recently broken, it needs confirmation to establish a new support level.

Watch for confirmation above the 66.00 level with supporting volume to solidify this breakout.

Actionable Insights

Consider entry if the price sustains above 66.00 with continued volume support.

Monitor for reversal signals near 66.00 if the breakout fails.

Be aware of potential pullbacks to the new support level to test its strength.

The AI Technical Analysis Center is an informational tool only and does not constitute investment or trading advice.
This site is registered on wpml.org as a development site. Switch to a production site key to remove this banner.