Generic selectors
Exact matches only
Search in title
Search in content
Post Type Selectors

Popular stocks

Crypto

CFD

Currencies

Support

Gold

OIL – Technical Analysis – 4h

September 29, 2025 16:00

Quick Summary

The recent analysis of ‘s chart reveals a distinct pattern.

The asset is currently experiencing notable movements with key levels being tested.

Technical indicators are providing insights into potential future directions.

Candlestick Analysis

The current trend appears to be bearish after a recent pullback from a higher peak. The presence of consecutive red candlesticks indicates selling pressure.

There's a series of declining candlesticks suggesting a bearish continuation pattern. No distinct reversal patterns like a hammer or bullish engulfing are evident yet.

The price has pulled back sharply, and there's a noticeable drop from the recent high around 65.50.

MACD Analysis

The MACD line is below the Signal line, indicating a bearish crossover.

The MACD histogram is showing increasing negative bars, enhancing the bearish momentum.

No clear divergences between the MACD and price action are observed at this point, supporting the current bearish sentiment.

Volume Analysis

There's an increase in volume corresponding with the latest price drop, which supports the bearish move.

The spike in volume may suggest institutional selling interest, reinforcing the bearish outlook.

The persistent high volume trend could indicate sustained selling pressure.

Support & Resistance

A key support level appears around 63.00. A break below this could signal further decline.

The recent peak around 65.50 serves as a strong resistance level.

Traders should be vigilant around these key levels for potential breakouts or reversals.

Actionable Insights

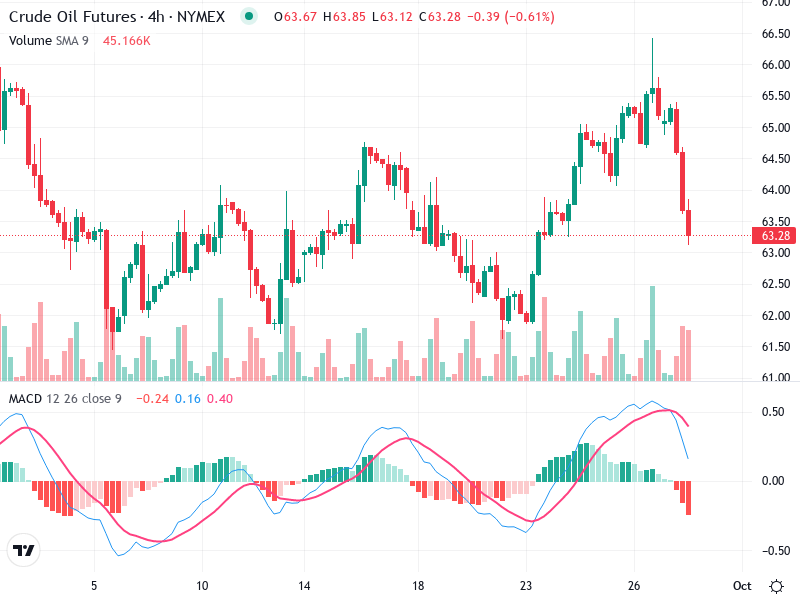
Monitor for a potential breakdown below the 63.00 support level, which could provide a selling opportunity.

Conversely, watching for any reversal signals above this level may suggest accumulation.

Be cautious of possible market reversals, especially if the volume subsides or a bullish pattern emerges near support.

The AI Technical Analysis Center is an informational tool only and does not constitute investment or trading advice.
This site is registered on wpml.org as a development site. Switch to a production site key to remove this banner.