Generic selectors
Exact matches only
Search in title
Search in content
Post Type Selectors

Popular stocks

Crypto

CFD

Currencies

Support

Gold

OIL – Technical Analysis – 4h

October 2, 2025 16:00

Quick Summary

The chart of indicates a current downturn in market conditions, but some technical signs suggest a potential shift.

Close analysis reveals key support and resistance levels crucial for future movement.

Candlestick Analysis

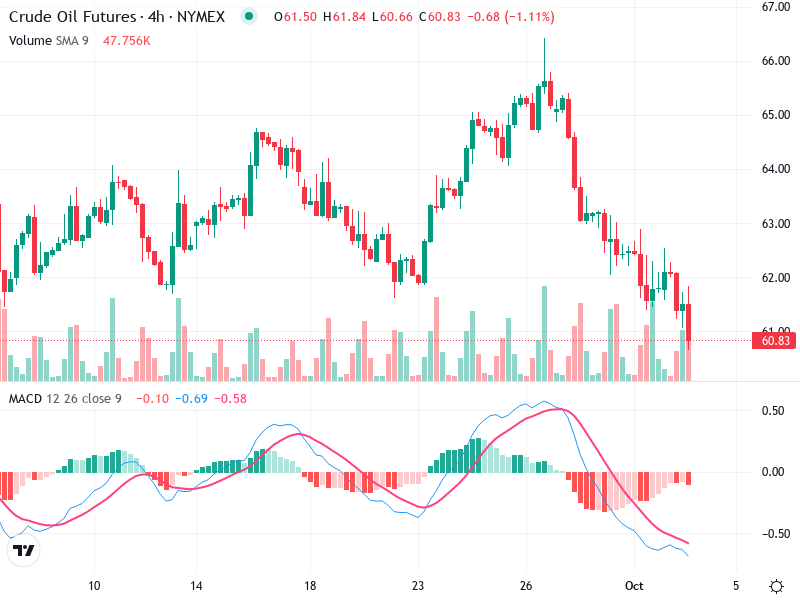
The chart shows a series of red candles indicating a bearish trend, but pay attention to a recent formation resembling a hammer near the current price level, which could suggest potential reversal if confirmed.

The overall trend is bearish, marked by consecutive lower highs and lower lows.

The recent low around $60 could be a potential support level, with the previous high near $65 serving as a resistance zone.

MACD Analysis

The MACD line is below the Signal line, indicating a bearish crossover around the start of October.

The histogram is showing negative bars, confirming bearish momentum. However, there is a slight reduction in the histogram's length, suggesting weakening bearish momentum.

No clear divergences between the MACD and price action are evident as both are showing bearish trends.

Volume Analysis

There is a noticeable increase in volume accompanying the recent downward movement, suggesting strong selling pressure.

The high volume on red candles validates the strength of the bearish trend.

The noticeable volume spikes on the recent downward candles may indicate institutional activity.

Support & Resistance

The potential support level is around $60, as this area has seen a price reaction.

Around $65 is a significant resistance zone, previously an area of multiple rejections.

The noticeable volume spikes on the recent downward candles may indicate institutional activity.

Actionable Insights

Traders might consider short positions if the price decisively breaks below the $60 support level, with a stop loss slightly above $60 to manage risk.

Watch for confirmation of reversal signs near support, with a potential upside target near $65 if a valid reversal pattern occurs.

Consolidation or reversal needs clear confirmation with increased volume or a bullish candlestick pattern formation for a shift in strategy.

The AI Technical Analysis Center is an informational tool only and does not constitute investment or trading advice.
This site is registered on wpml.org as a development site. Switch to a production site key to remove this banner.