Generic selectors
Exact matches only
Search in title
Search in content
Post Type Selectors

Popular stocks

Crypto

CFD

Currencies

Support

Gold

OIL – Technical Analysis – 4h

October 6, 2025 16:01

Quick Summary

The Crude Oil Futures chart indicates potential changes with notable patterns and signals. Recent formations show signs of possible bullish reversal after a long bearish trend. Key support and resistance levels could guide future price movements.

Candlestick Analysis

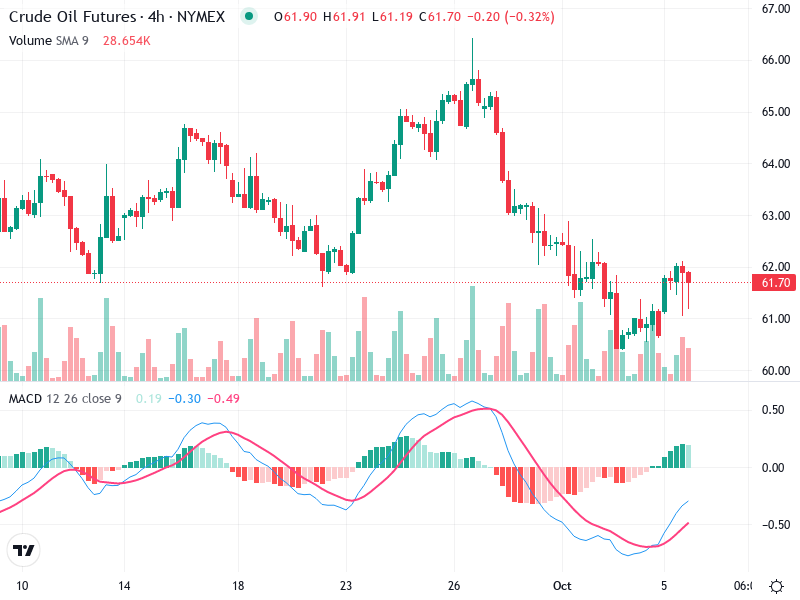
Recently, there appears to be a bullish reversal pattern forming, seen in the larger green candles following a significant decline, suggesting a possible trend change.

The overall trend has been bearish, with a series of lower highs and lower lows. However, recent price action indicates potential stabilization or a reversal.

A breakout zone is observed around the $62 mark, which aligns with previous highs. A sustained move above could indicate further bullish momentum.

MACD Analysis

The MACD line is above the Signal line, indicating a bullish crossover. This suggests growing upward momentum.

The histogram is currently positive, reinforcing the sentiment of upward momentum.

There appears to be a divergence with price making new lows, while the MACD does not follow suit, indicating potential bullish sentiment.

Volume Analysis

There was an increase in volume accompanying the bullish candlestick formations. This supports the potential reversal, as higher volume often confirms price action.

Notable volume spikes coincide with upward price movements, suggesting possible institutional buying.

The increase in trading volume signals heightened market participation, particularly during upward price moves.

Support & Resistance

Key support is around $60.50, which has been tested multiple times recently.

Immediate resistance is around $62, followed by another at $64 based on previous highs.

Breach of these levels could dictate future price direction, pending confirmation from other technical indicators.

Actionable Insights

Consider buying if there is a confirmed breakout above $62 with increased volume, targeting the next resistance at $64.

If the price fails to break $62 and reverses with significant volume, consider selling, targeting support at $60.50.

Currently, holding might be wise while waiting for confirmation of breaking either support or resistance.

The AI Technical Analysis Center is an informational tool only and does not constitute investment or trading advice.
This site is registered on wpml.org as a development site. Switch to a production site key to remove this banner.