Generic selectors
Exact matches only
Search in title
Search in content
Post Type Selectors

Popular stocks

Crypto

CFD

Currencies

Support

Gold

OIL – Technical Analysis – 4h

October 8, 2025 16:01

Quick Summary

The chart for Crude Oil Futures reveals a shift from bearish to bullish sentiment. Recent price actions reflect a recovery following a significant dip. Observing the trend, Crude Oil Futures shows signs of potential upward movement.

Candlestick Analysis

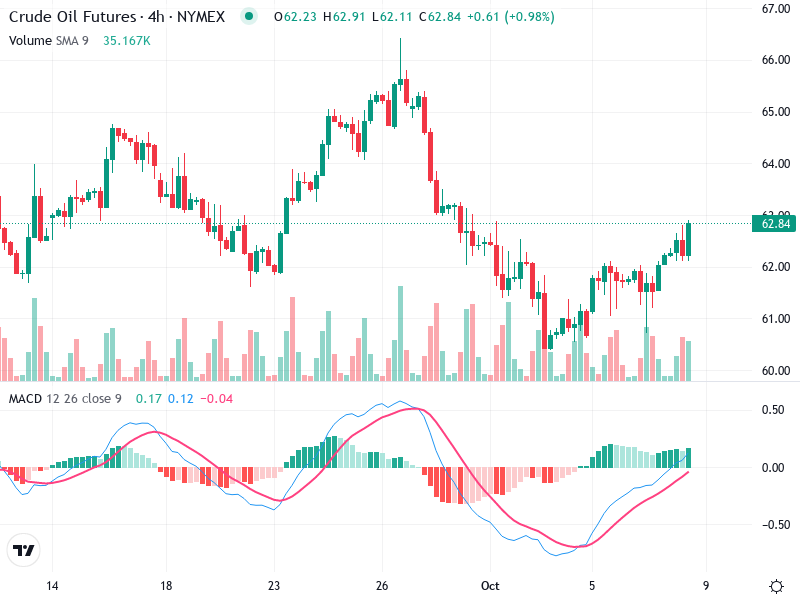
The overall trend seems to have shifted from a bearish to a more bullish sentiment. After a significant dip, there's a recovery visible on the chart.

A potential bullish engulfing pattern appears around the start of October, indicating a possible reversal from the preceding downtrend. A doji formation occurs prior to the upward movement, suggesting indecision before the bulls took control.

The price seems to have recently broken through a resistance level around the $62 mark and is testing new highs, indicating a potential breakout.

MACD Analysis

There has been a bullish crossover, where the MACD line crosses above the signal line. This typically signals the start of a bullish trend.

The histogram has shifted from negative to positive, suggesting increasing bullish momentum.

No apparent divergence between MACD and price action, confirming the current price trend.

Volume Analysis

There's a notable increase in volume coinciding with the recent price rise. This suggests that the current price action is supported by substantial trading activity.

The increase in volume validates the bullish reversal as it shows higher trader interest in the upward move.

No significant unusual volume spikes; however, the consistent increase in volume is encouraging for bulls.

Support & Resistance

The previous resistance around $62 has now turned into support. Continued movement above this level can confirm the beginning of a new bullish phase.

Strong support is noted around the $60 level, where previous consolidation occurred.

Actionable Insights

Consider entry at current levels if confirmed by sustained volume above the previous resistance ($62). Look for a continuation of the bullish momentum supported by MACD and volume.

Exercise caution if the price falls back below the $62 support level with increasing volume; this might indicate a false breakout.

For those already long, continue to hold if the price remains above $62 with a watchful eye on trading volume for any signs of reversal.

The AI Technical Analysis Center is an informational tool only and does not constitute investment or trading advice.
This site is registered on wpml.org as a development site. Switch to a production site key to remove this banner.