Generic selectors
Exact matches only
Search in title
Search in content
Post Type Selectors

Popular stocks

Crypto

CFD

Currencies

Support

Gold

OIL – Technical Analysis – 4h

October 9, 2025 16:00

Quick Summary

The chart for suggests a sideways movement following a bearish phase. After a decline from $66 to the current price range near $60, stability is appearing. Key levels are beginning to define potential future movements.

Monitoring these levels could provide insight into the next directional move, with fundamental factors also playing a role in upcoming price action.

Candlestick Analysis

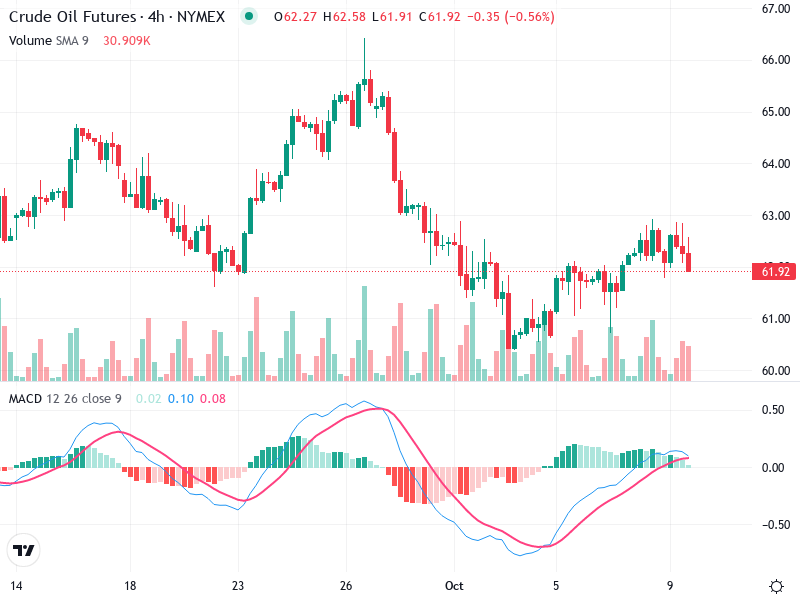
The trend has turned sideways after a clear bearish phase. The price declined from a peak near $66 to around $60, finding some stability.

There are no major reversal patterns visible currently, such as bullish engulfing or hammer. However, there are small-bodied candles and dojis indicating indecision near $61.50 to $62.

The recent price action shows consolidation, suggesting a potential breakout may hinge around the $63 resistance and $61 support levels.

MACD Analysis

The MACD line is close to the signal line but shows a slight bearish crossover, indicating weakening bullish momentum.

The histogram bars are shallow and slightly negative, implying reduced momentum and potential consolidation.

No clear divergence observed between MACD and price action at this time.

Volume Analysis

Volume has tapered off after the prior decline, stabilizing but not showing strong momentum in either direction.

The low volume supports the sideways movement and lack of a strong price move.

No significant spikes that might suggest aggressive institutional buying or selling.

Support & Resistance

Key support is located around $61, having been tested multiple times. Sustaining above this could favor bulls.

Immediate resistance at $63 needs to be broken convincingly for any potential upside momentum.

Watching these levels closely could indicate the next move.

Actionable Insights

Consider buying if the price breaks above $63 with volume confirmation.

Selling might be suitable if there is a break below $61, indicating potential further downside.

Holding might be the best strategy if the price continues to trade within the current range unless further signals emerge.

The AI Technical Analysis Center is an informational tool only and does not constitute investment or trading advice.
This site is registered on wpml.org as a development site. Switch to a production site key to remove this banner.