Generic selectors
Exact matches only
Search in title
Search in content
Post Type Selectors

Popular stocks

Crypto

CFD

Currencies

Support

Gold

OIL – Technical Analysis – 4h

October 14, 2025 16:01

Quick Summary

The asset currently shows a bearish trend on the chart. The analysis suggests potential support at key price levels, with recent movements needing confirmation for any trend change.

Key indicators such as MACD and volume also suggest caution for traders, with opportunities potentially emerging if certain thresholds are crossed.

Candlestick Analysis

The chart shows a bearish trend overall with a series of lower highs and lower lows, indicating ongoing downward pressure.

Recent candles suggest potential support near the $58 level with a small bullish rebound. However, there is no clear bullish reversal pattern yet.

A break above the $60 level would need to occur to challenge the current bearish trend, but if $58 fails to hold, further declines could be expected.

MACD Analysis

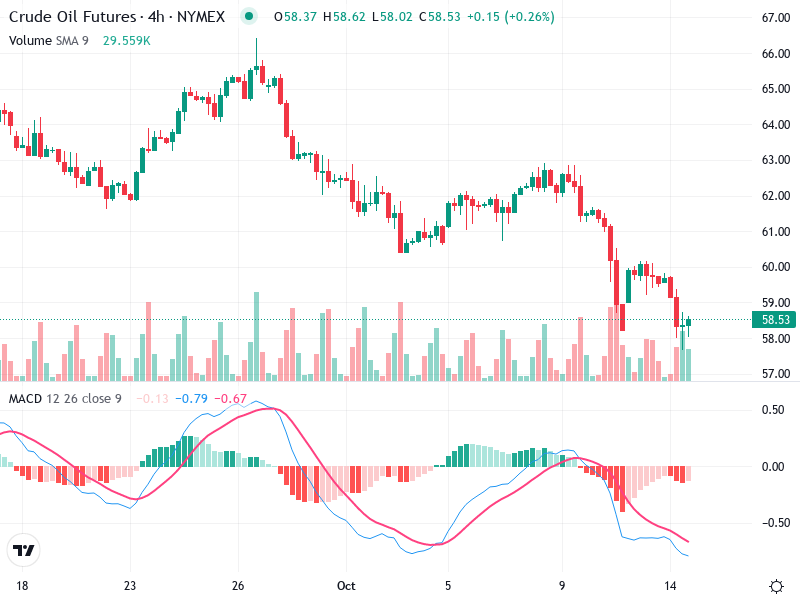
The MACD line is below the Signal line, reflecting a bearish momentum. However, they appear close to converging, which might suggest a potential reversal if a bullish crossover occurs.

The histogram bars are negative, but there are signs of contraction, indicating a potential weakening of bearish momentum.

No significant divergences are observed currently between MACD and price action.

Volume Analysis

There is an increase in volume on down days, which supports the bearish trend. However, the recent volume spike on a day with a small bullish candle could imply some buying interest at current levels.

The spike in volume near the $58 region suggests potential accumulation by institutional players, but confirmation is needed for a trend change.

Support & Resistance

Key support is around the $58 mark, which has held recently.

Near-term resistance lies at $60 and stronger resistance at around $63, aligning with previous highs.

Actionable Insights

Await a confirmed bullish candle and a MACD crossover above the Signal line for a short-term buy opportunity.

If price breaks below the $58 support with strong volume, it could trigger a sell signal.

Monitor for volume confirmation and MACD crossover for any bullish reversal. Also, keep an eye on how the price interacts with the $60 resistance level.

The AI Technical Analysis Center is an informational tool only and does not constitute investment or trading advice.
This site is registered on wpml.org as a development site. Switch to a production site key to remove this banner.