Generic selectors
Exact matches only
Search in title
Search in content
Post Type Selectors

Popular stocks

Crypto

CFD

Currencies

Support

Gold

OIL – Technical Analysis – 4h

October 16, 2025 16:01

Quick Summary

The Crude Oil Futures chart illustrates a rather bearish sentiment marked by consistent lower highs and lower lows. The asset is currently consolidating near a key support level, which could serve as a critical point for future price movements. Various technical indicators show potential sustained downward momentum unless significant volume-based breakouts occur.

Candlestick Analysis

The overall trend is bearish, with a series of lower highs and lower lows visible on the chart.

Recently, there seems to be a consolidation at the support level around 58.00. No dominant candlestick reversal patterns are identified at the moment.

A potential breakout could occur if the price breaches the 58.00 support level significantly or manages to surpass 59.50 on the upside.

MACD Analysis

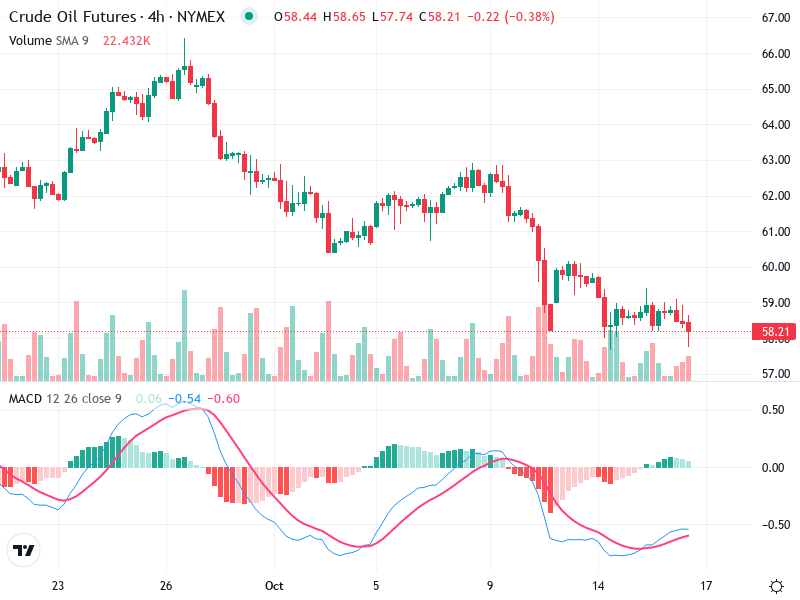
The MACD line is slightly below the Signal line, indicating a bearish crossover, which suggests continued downward momentum.

The histogram is in negative territory, showing weak momentum. However, there is a slight shift towards less negative bars, suggesting the bearish momentum might be slowing.

There are no clear divergences visible between the MACD and the price action, reaffirming the current bearish sentiment.

Volume Analysis

There is consistent volume, with certain spikes accompanying the downward price movements.

Increase in volume on bearish days supports the downward price action, suggesting strong selling pressure.

Significant spikes in volume during downward movements imply potential institutional selling, reinforcing the bearish outlook.

Support & Resistance

The immediate support level is around 58.00. A failure to hold this level may lead to further declines.

Resistance is evident around the 59.50-60.00 zone, where previous attempts to rally have failed.

Key support and resistance levels should be watched to determine future price action.

Actionable Insights

Consider holding or selling if the price closes below the 58.00 level on strong volume. For a buy strategy, look for a confirmed breakout above 59.50 with a significant increase in volume.

Monitor for any bullish reversal patterns or significant volume changes to gauge potential trend reversals.

Traders should remain cautious given the bearish signals. Watch for key support and resistance levels to determine future price action.

The AI Technical Analysis Center is an informational tool only and does not constitute investment or trading advice.
This site is registered on wpml.org as a development site. Switch to a production site key to remove this banner.