Generic selectors
Exact matches only
Search in title
Search in content
Post Type Selectors

Popular stocks

Crypto

CFD

Currencies

Support

Gold

OIL – Technical Analysis – 4h

August 27, 2025 07:09

Quick Summary

The chart indicates an emerging trend with key levels in focus. A recent pullback may suggest consolidation. Breakouts could provide confirmation for future direction.

Candlestick Analysis

The chart depicts a recent upward trend after a sharp decline in early August.

A bullish reversal pattern is noticeable around mid-August, followed by a consolidation phase.

Recently, a small bearish candle suggests some selling pressure.

MACD Analysis

A bearish crossover occurred recently, indicating potential short-term downside momentum.

The histogram is decreasing, supporting the bearish sentiment and suggesting diminishing bullish momentum.

There is no apparent divergence between the MACD and price action.

Volume Analysis

There's an increase in volume during the upward push in the third week of August, supporting the price increase.

The decreasing volume in the recent pullback suggests a lack of strong selling pressure.

The spike in volume during mid-August could indicate institutional involvement in the reversal.

Support & Resistance

Key support is at $62, which has been tested multiple times.

Significant resistance is seen around $65, where price previously faced selling pressure.

These levels are crucial for determining future direction.

Actionable Insights

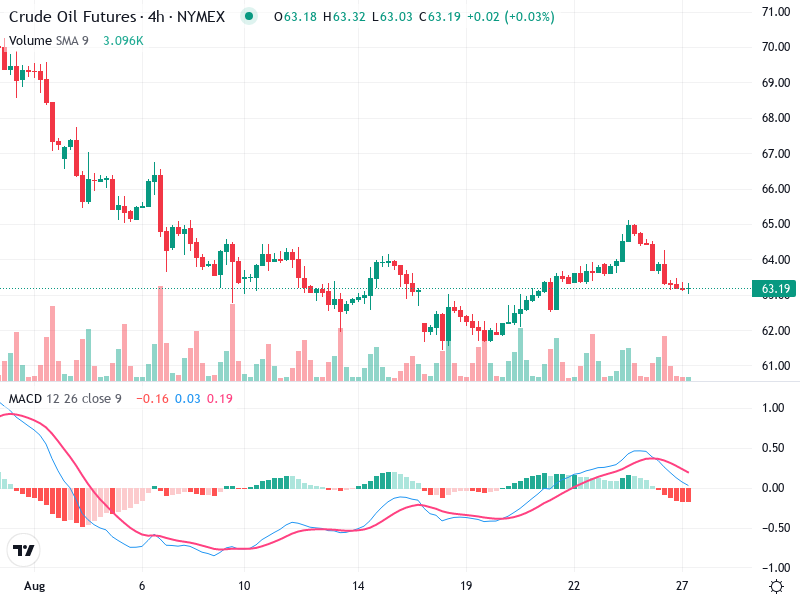
Consider buying if the price breaks above the $65 resistance with strong volume, confirming an upward momentum.

Watch for a break below the $62 support with increasing volume for potential short opportunities.

If the price remains between $62 and $65, consider holding until a clearer trend emerges.

The AI Technical Analysis Center is an informational tool only and does not constitute investment or trading advice.
This site is registered on wpml.org as a development site. Switch to a production site key to remove this banner.