Generic selectors
Exact matches only
Search in title
Search in content
Post Type Selectors

Popular stocks

Crypto

CFD

Currencies

Support

Gold

OIL – Technical Analysis – 4h

October 20, 2025 16:00

Quick Summary

The chart for reveals critical trends and potential movements.

The analysis highlights current technical indicators and suggests possible future directions.

Candlestick Analysis

The chart exhibits a bearish trend. The series of lower highs and lower lows indicates a downtrend, suggesting that sellers have been dominant.

There are no immediate classic bullish reversal patterns (such as a hammer or bullish engulfing) visible.

The recent candlesticks show indecision, typical of potential consolidation or a pause in trend.

MACD Analysis

The MACD line is below the Signal line, which is indicative of a bearish crossover. This signifies ongoing bearish momentum.

The histogram shows declining negative values, suggesting momentum is still bearish but could be weakening.

There's no prominent divergence between the MACD and price action at present.

Volume Analysis

Noticeable increase in volume during the most recent sell-off, often indicative of strong bearish sentiment and possibly institutional selling.

Rising volume on down days confirms the bearish trend.

The current sideways movement has lower volume, which usually accompanies consolidation.

Support & Resistance

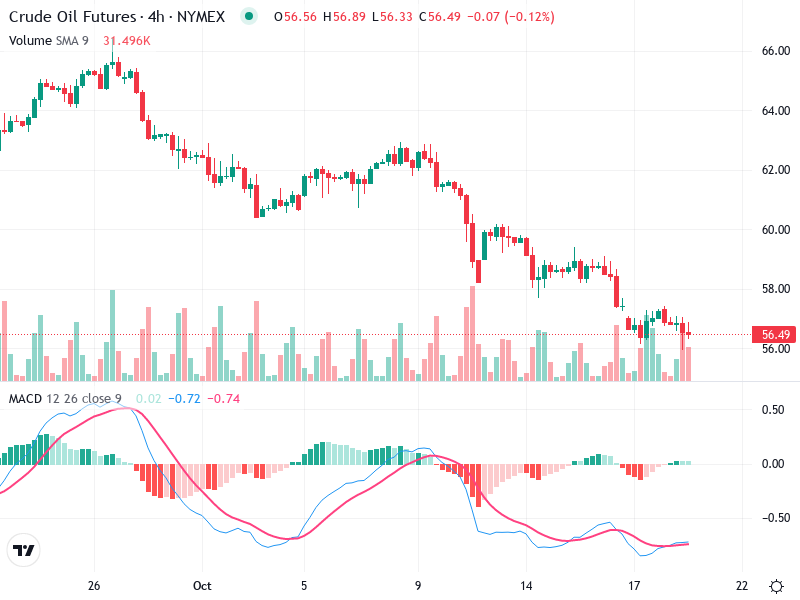
Key pullback level around $58 appears to have rejected recent upward moves, acting as a resistance.

Around the $56 area, providing some level of buying interest and potentially preventing lower price moves.

Around the $58 level, repeatedly tested and held, acting as a cap on the price's recent upward attempts.

Actionable Insights

Given the bearish indicators, it would be prudent to maintain sell positions or wait for clear reversal signals before considering buys.

Observe for bullish candlestick patterns or MACD crossover for a potential buy signal.

Look for volume confirmation on any breakout or breakdown. Pay attention to the $58 resistance and $56 support levels for potential reversal or continuation patterns.

The AI Technical Analysis Center is an informational tool only and does not constitute investment or trading advice.
This site is registered on wpml.org as a development site. Switch to a production site key to remove this banner.