October 29, 2025 17:02
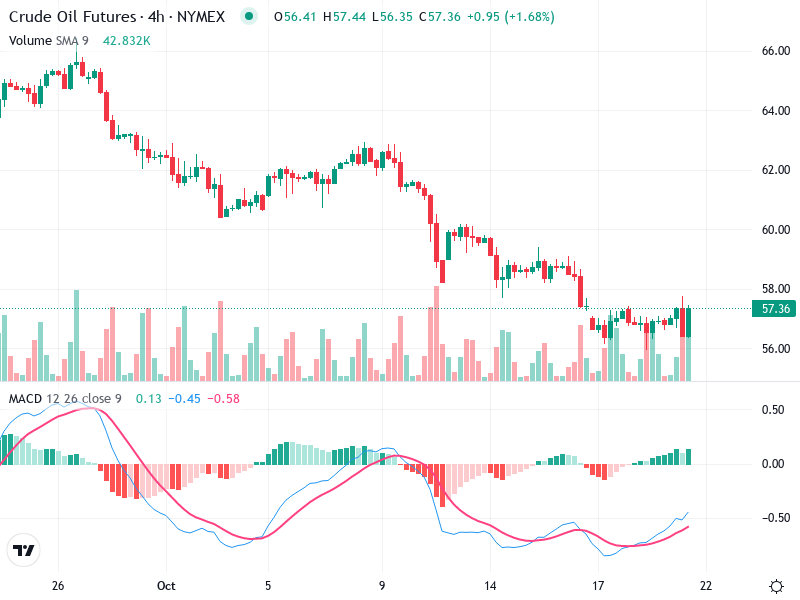
The chart for Asset reveals a recent downtrend that seems to be stabilizing near current levels. A notable pattern is the emergence of a strong green candlestick, suggesting a potential bullish reversal. Breakout through a previous resistance indicates a bullish sentiment in the market.
The direction is favorably leaning towards bullish, supported by key technical indicators.
The chart shows a recent downtrend, but there is potential stabilization with a sideways trend near the current level.
The last few candlesticks indicate a strong green candlestick, possibly signifying a bullish reversal or a relief rally.
The price recently broke through a previous resistance level around $57. The next resistance appears near $58, with support around $56.
The MACD line is approaching a bullish crossover above the Signal line, suggesting a potential upward momentum.
The histogram is moving from negative towards zero, indicating diminishing bearish momentum and potential for a bullish shift.
There are no significant divergences visible between the MACD and price action currently.
There is a noticeable increase in volume on the recent upward move, which lends support to the bullish candlesticks and suggests buying interest.
The volume spikes indicate possible institutional buying, especially given the increase with a green candlestick.
Key support is around $56, where the price rebounded from recent lows.
Resistance is around $58, a level that has been tested previously.
A breakout above $58 with sustained volume could present a buying opportunity, targeting higher resistance levels.
Consider exiting long positions if the price fails to hold support at $56.
Current holdings could be maintained with a close eye on the potential breakout or rejection at resistance.