Generic selectors
Exact matches only
Search in title
Search in content
Post Type Selectors

Popular stocks

Crypto

CFD

Currencies

Support

Gold

OIL – Technical Analysis – 4h

October 28, 2025 17:01

Quick Summary

This analysis covers the current technical trends observed for the asset, including key support and resistance levels.

The overall sentiment is assessed using candlestick patterns, MACD signals, and volume metrics.

Candlestick Analysis

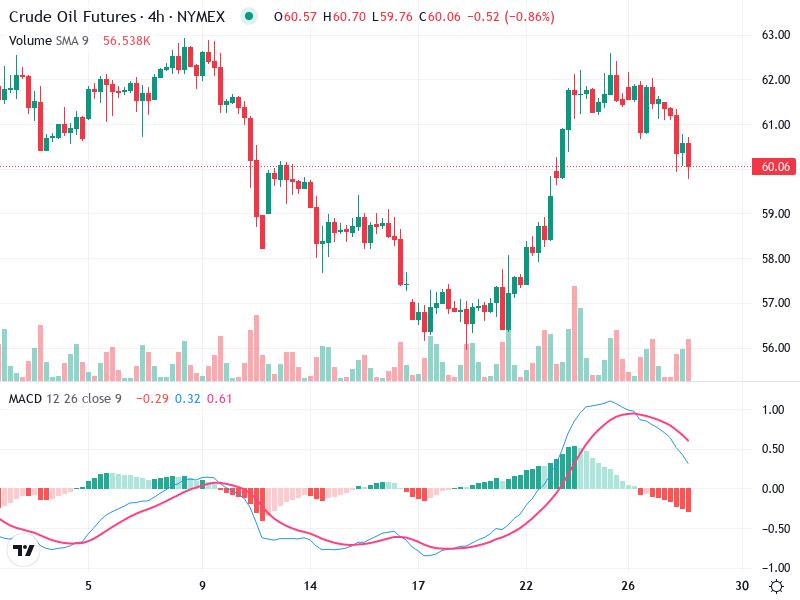
Recent candlestick patterns suggest potential bearishness following an uptrend.

No clear bullish reversal patterns, like bullish engulfing or hammer, are observed.

A significant pullback around $62 indicates resistance, with current testing of support around $60.

MACD Analysis

The MACD line has crossed below the Signal line, signaling a bearish crossover.

The histogram shows growing negative bars, pointing to increased bearish momentum.

No significant divergences between MACD and price, but the crossover indicates bearish sentiment.

Volume Analysis

Volume saw a moderate increase during the recent rally, aiding the upward movement.

Recent volume fluctuations lack strong signals, and moderate selling pressure is noted.

There are no unusual volume spikes suggesting strong institutional activity.

Support & Resistance

Key support level is near $60; breaching this could lead to further downturn towards $58.

Resistance is at $62, where a breakout was attempted but failed.

Current price movement is testing these critical levels.

Actionable Insights

Consider shorting if price breaks below $60 support, confirmed by volume.

If holding positions, look for reversal signs around current support.

Monitor price action closely at the $60 level for potential sell signals.

The AI Technical Analysis Center is an informational tool only and does not constitute investment or trading advice.
This site is registered on wpml.org as a development site. Switch to a production site key to remove this banner.