Generic selectors
Exact matches only
Search in title
Search in content
Post Type Selectors

Popular stocks

Crypto

CFD

Currencies

Support

Gold

OIL – Technical Analysis – 4h

October 31, 2025 17:00

Quick Summary

The chart provides an overview of ‘s recent price movement with key indicators for analysis. It highlights areas of potential breakout and key support and resistance levels.

There is a focus on examining the strength of various signals to predict future direction.

Candlestick Analysis

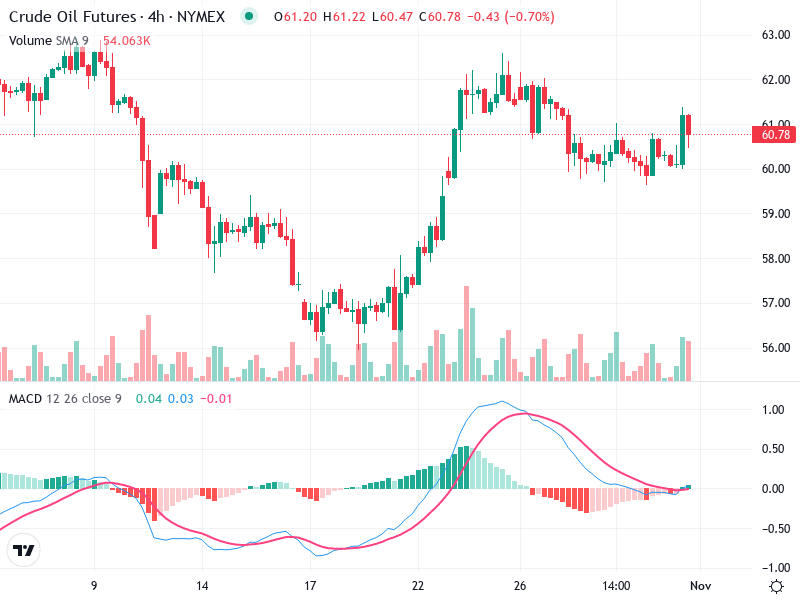
There's a small bullish candlestick near the current price level, suggesting a potential attempt to move higher.

Earlier, there's an engulfing bullish pattern near the 57 level, indicating a reversal from a previous downtrend.

The overall trend shows a recent bullish reversal from a downtrend, with some consolidation in the current range.

MACD Analysis

The MACD line is close to the signal line, with a recent bullish crossover indicating a potential rise in momentum.

The positive histogram bars show increasing bullish momentum, though it remains weak.

No noticeable divergences between MACD and price, suggesting current price movements are supported by MACD momentum.

Volume Analysis

There is an increase in volume during recent price rises, supporting bullish action.

Volume supports recent price increases, indicating potential buying interest at current levels.

A notable volume spike accompanies a price rise around the breakout attempt near 61.

Support & Resistance

Key support is evident around 57, which marked the reversal zone in the previous downtrend.

The immediate resistance is at 61, a significant level to watch for a breakout.

Potential resistance around 62 should also be considered following a successful breakout.

Actionable Insights

Consider buying if the price breaks and holds above 61 with increased volume, using the 57 level as a stop-loss.

Be cautious if the price fails to break 61 convincingly, or if MACD and volume weaken significantly.

If the price remains between 57 and 61, monitor for further signals of breakout or breakdown.

The AI Technical Analysis Center is an informational tool only and does not constitute investment or trading advice.
This site is registered on wpml.org as a development site. Switch to a production site key to remove this banner.