Generic selectors
Exact matches only
Search in title
Search in content
Post Type Selectors

Popular stocks

Crypto

CFD

Currencies

Support

Gold

OIL – Technical Analysis – 4h

November 13, 2025 17:01

Quick Summary

The Crude Oil Futures chart indicates a cautious market sentiment with potential for a bullish reversal. Recent analysis shows a dynamic interaction between key support and resistance levels.

Overall, the chart demonstrates a complex picture of potential trends influenced by both technical factors and broader market conditions.

Candlestick Analysis

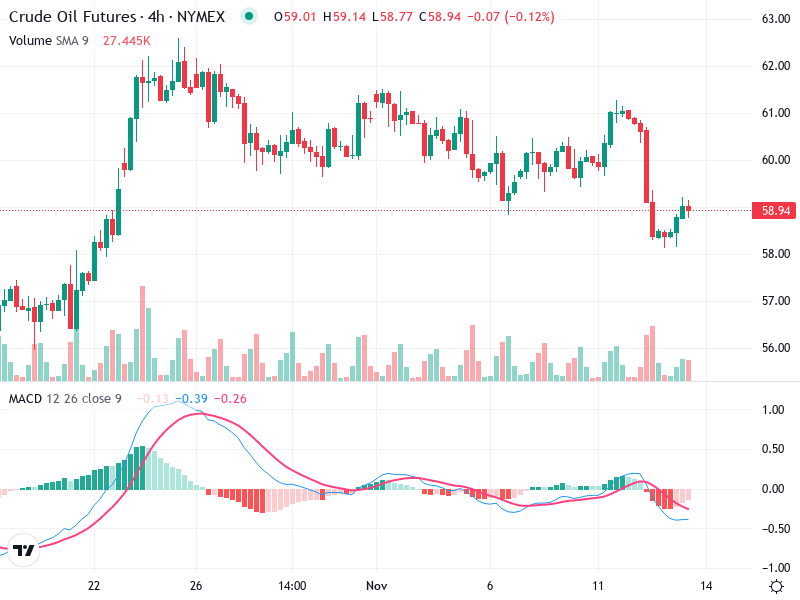
Recently, there was a noticeable bullish hammer pattern indicating a potential reversal to the upside.

The overall trend appears to be bearish in the short term, with a recent sharp decline followed by some recovery.

The recent breakout below $60 indicates potential to continue lower, but the current recovery suggests testing previous support-turned-resistance at this level.

MACD Analysis

The MACD line and Signal line recently experienced a bearish crossover, indicating bearish momentum.

The MACD histogram shows decreasing bearish momentum, aligning with the possible reversal suggested by the candlestick pattern.

There are currently no clear divergences between the MACD and price action on this chart.

Volume Analysis

There was a spike in trading volume accompanying the recent price decline, suggesting strong selling pressure.

The subsequent lower volume on the recovery indicates weaker demand in the short term.

Unusually high volume during the price drop suggests possible institutional selling activity.

Support & Resistance

Around $58 appears to be a recent support level, where the price has shown some resilience.

The $60 level now acts as a significant resistance point, crucial for any further upward movement.

Monitoring these levels may provide insights for future price direction.

Actionable Insights

Consider entering a long position if there is a confirmed break above $60 with strong volume.

Short positions may be considered if prices fail to break $60 and start declining sharply again.

Monitor the $60 resistance and watch for a confirmed trend reversal.

The AI Technical Analysis Center is an informational tool only and does not constitute investment or trading advice.
This site is registered on wpml.org as a development site. Switch to a production site key to remove this banner.