Generic selectors
Exact matches only
Search in title
Search in content
Post Type Selectors

Popular stocks

Crypto

CFD

Currencies

Support

Gold

OIL – Technical Analysis – 4h

November 18, 2025 17:01

Quick Summary

The Crude Oil Futures chart shows a sideways trading pattern between $58.50 and $61.00, indicating market indecision. A key bullish engulfing pattern suggests short-term reversal potential. Examination of key technical indicators provides insights into potential price direction.

Candlestick Analysis

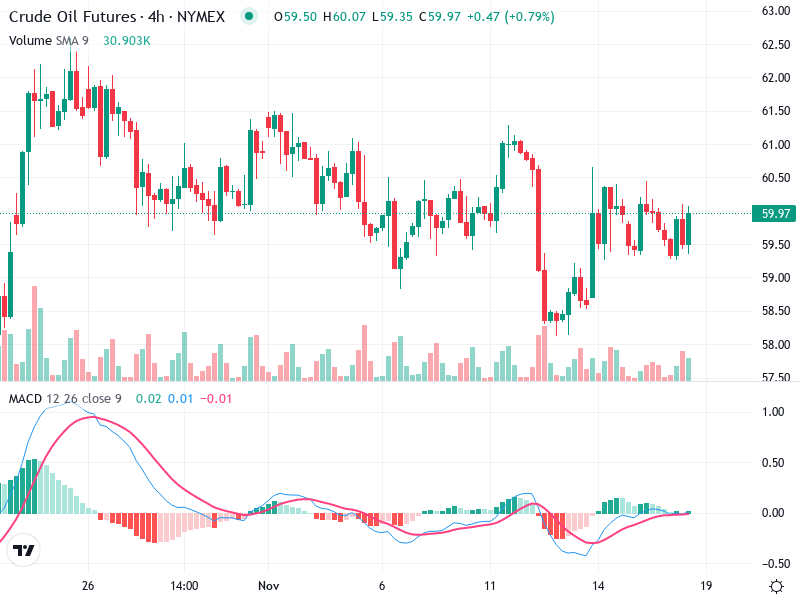
The trend in crude oil futures is sideways, confined to a range of $58.50 to $61.00, indicating indecision.

A bullish engulfing pattern observed on November 4th suggests a short-term reversal could be imminent.

No significant breakouts are noted, with prices moving within a defined channel.

MACD Analysis

The MACD line is slightly above the Signal line, which may indicate a potential bullish crossover, albeit with weak momentum.

The histogram's small positive values imply possible upward momentum with limited strength.

No clear divergence is evident between MACD and price action at this moment.

Volume Analysis

Volume spikes correlate with price movements around support and resistance, suggesting possible institutional interest.

Current stable volume does not strongly support any dramatic price moves.

No unusual volume spikes detected recently; volume remains close to the moving average.

Support & Resistance

Key support is identified around $58.50, a region where buying interest has emerged.

Resistance is found near $61.00, where price rejections have been common.

Further analysis of support and resistance is required for potential breakout scenarios.

Actionable Insights

Traders might consider range-bound strategies, buying near $58.50 and selling close to $61.00 resistance.

A breakout above $61.00 or a breakdown below $58.50 could signal a trend shift, necessitating strategy reassessment.

Continued sideways movement might result in false breakouts; confirmation is crucial before acting on breakout signals.

The AI Technical Analysis Center is an informational tool only and does not constitute investment or trading advice.
This site is registered on wpml.org as a development site. Switch to a production site key to remove this banner.