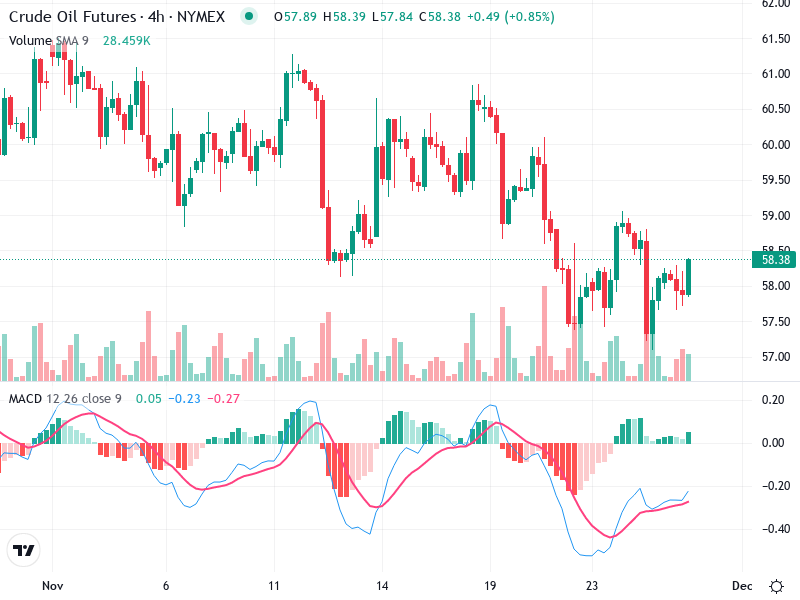
The Crude Oil Futures chart indicates potential changes in market sentiment. Key patterns and volume trends suggest a possible shift. Monitoring support and resistance levels is crucial for future movements.
Candlestick Analysis
The chart shows the formation of several candlestick patterns.
Notably, there's a hammer-like pattern near the recent bottom, suggesting a potential reversal.
The presence of doji candles indicates indecision around key price points.
MACD Analysis
The MACD line is close to crossing above the signal line, indicating a potential bullish crossover.
The MACD histogram is transitioning from negative to positive territory.
There is no clear divergence observed between the MACD and the price action in this chart.
Volume Analysis
The volume spikes coincide with attempted price reversals, particularly around key support zones.
Increased volume on upward moves suggests accumulation.
The volume spikes around the recent lows may indicate institutional buying interest.
Support & Resistance
The area around $57.50 acts as a significant support level.
Resistance is observed near $58.50 - $59.00.
A breakout above this could fuel further gains.
Actionable Insights
Consider buying if the price closes above $58.50 with strong volume.
Traders could consider exiting long positions if the price closes below the support at $57.50.
Long-term holders may wait for clearer breakout confirmation above $59.00 before making decisions.
The AI Technical Analysis Center is an informational tool only and does not constitute investment or trading advice.