Generic selectors
Exact matches only
Search in title
Search in content
Post Type Selectors

Popular stocks

Crypto

CFD

Currencies

Support

Gold

OIL – Technical Analysis – 4h

December 8, 2025 17:01

Quick Summary

The Crude Oil Futures chart suggests cautious trading, with a predominant bearish sentiment displayed in technical indicators. Recent price oscillations and candlestick patterns provide insights into potential directional changes.

The asset name clearly reflects an ongoing battle between bullish and bearish forces, necessitating close monitoring of support and resistance levels.

Candlestick Analysis

The overall trend appears sideways with a slight bullish inclination, as evidenced by price oscillations between $58.50 to $61.00.

There is a recent bearish candlestick with a noticeable body following a series of shorter candlesticks, indicating potential bearish pressure.

Previous sections show bullish engulfing patterns that might have driven price recoveries.

MACD Analysis

The MACD line is below the Signal line, indicating a bearish crossover. This suggests bearish momentum is prevailing.

The MACD histogram shows a growing negative divergence, emphasizing decreasing momentum.

No significant divergences noticed between MACD and price action. Both indicate bearish sentiment currently.

Volume Analysis

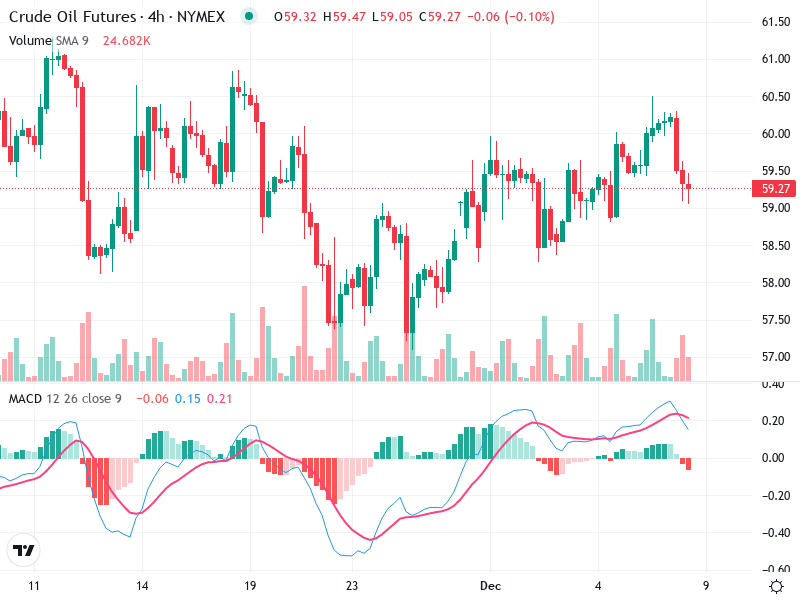
There is a noticeable increase in volume during the latest bearish candlestick, suggesting confirmed selling pressure.

Volume spikes often accompany upward movements, supporting the bullish moves seen previously, whereas lower volume appears in sideways parts of the trend.

A recent volume spike aligns with recent price declines, possibly indicating institutional selling.

Support & Resistance

Resistance: Around $60.50 to $61.00, where previous price attempts reversed.

Support: The $59.00 level holds as immediate support, crucial for short-term bearish invalidation.

Pay close attention to any geopolitical news affecting crude oil prices, as this could trigger significant volatility and trend changes.

Actionable Insights

Given the bearish crossover and increasing negative price momentum, consider short positions if the price breaks below $59.00 with substantiated volume.

A rebound from the $59.00 support level could signal a good buy opportunity, especially if coupled with a bullish crossover on the MACD.

Traders should remain vigilant for shifts in MACD and volume indicators to confirm any changes in trend direction.

The AI Technical Analysis Center is an informational tool only and does not constitute investment or trading advice.
This site is registered on wpml.org as a development site. Switch to a production site key to remove this banner.