Generic selectors
Exact matches only
Search in title
Search in content
Post Type Selectors

Popular stocks

Crypto

CFD

Currencies

Support

Gold

OIL – Technical Analysis – 4h

December 19, 2025 17:00

Quick Summary

The technical analysis of the asset shows emerging bullish signals. The asset’s chart has exhibited recent signs of stabilization and potential reversal after a downtrend. Key indicators suggest that there might be a shift in market sentiment.

Candlestick Analysis

Recently, there's a noticeable bullish reversal pattern, a possible hammer, suggesting buying interest at lower levels.

The chart exhibits a bearish trend overall with recent stabilization and potential reversal signs.

There seems to be a consolidation around $56, indicating a potential breakout point.

MACD Analysis

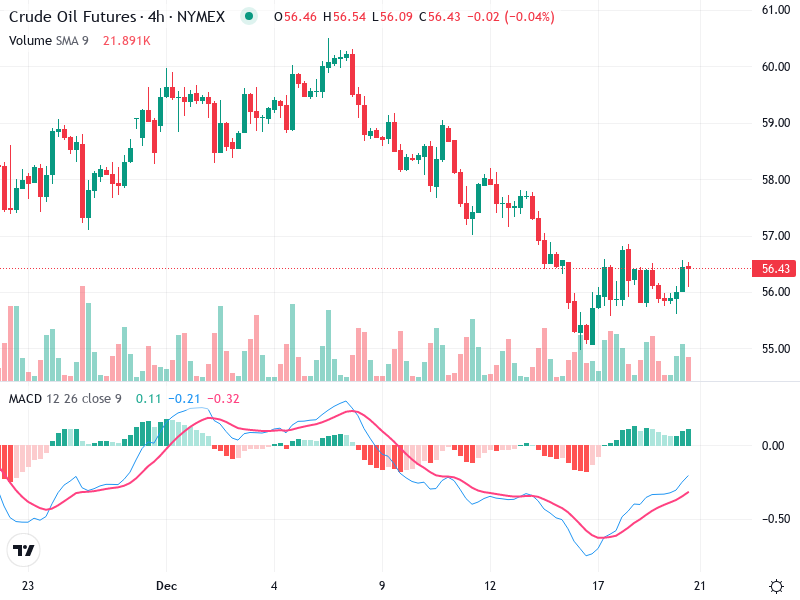
The MACD line is crossing above the Signal line, indicating a bullish crossover, which suggests increasing bullish momentum.

The histogram is turning positive, reinforcing the potential for upward momentum.

There is no clear divergence between MACD and price action currently, but the bullish crossover after a downtrend could indicate a reversal.

Volume Analysis

There's been an increase in volume during the recent price drop, often a sign of panic selling or capitulation.

The recent spikes in volume paired with stabilization hint at potential accumulation.

Volume spikes could hint at institutional buying, especially as the volume was high near the lower price points.

Support & Resistance

Strong support is likely around the $55.00 level, as indicated by previous lows.

Resistance appears strong around $57.00, requiring a breakout for further bullish confirmation.

Monitoring these levels could provide insights into market movement.

Actionable Insights

Consider a buy strategy if there is a confirmed breakout above $57.00 with supporting volume, as this indicates further upward momentum.

A tight stop-loss below $55.00 could be prudent, considering the recent lows.

Confirmation of the bullish crossover in MACD by observing sustained positive momentum and increasing volume as price approaches $57.00.

The AI Technical Analysis Center is an informational tool only and does not constitute investment or trading advice.
This site is registered on wpml.org as a development site. Switch to a production site key to remove this banner.