Generic selectors
Exact matches only
Search in title
Search in content
Post Type Selectors

Popular stocks

Crypto

CFD

Currencies

Support

Gold

OIL – Technical Analysis – 4h

December 24, 2025 17:01

Quick Summary

The Crude Oil Futures chart illustrates a recent bullish reversal backed by both volume and MACD indicators. Traders are advised to keep an eye on significant resistance levels while monitoring the overall momentum of the asset. The technical indicators suggest potential for upward movement.

Candlestick Analysis

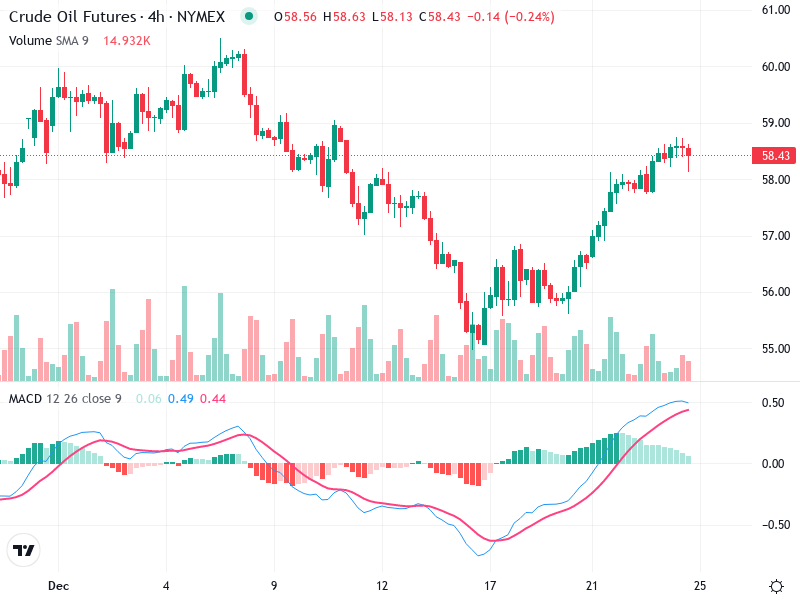
A notable bullish reversal pattern is identified mid-chart, characterized by a sequence of green candles following a marked downtrend, indicating potential for trend reversal.

The overall trend begins bearishly, with lower highs and lower lows, before transitioning into a bullish trend with higher highs and higher lows.

Consolidation around the $58.43 level is pivotal; a break above this could suggest sustained bullish momentum, whereas a failure may signify a pullback.

MACD Analysis

The MACD line is above the Signal line, indicating a recent bullish crossover and suggesting upward momentum.

The positive MACD histogram supports bullish momentum but shows signs of weakening, potentially indicating a slowing pace.

No clear divergence between MACD and price action suggests alignment between momentum and price direction.

Volume Analysis

A noticeable increase in volume during the transition from bearish to bullish trend supports the reversal.

The increased volume on upward price movement validates the bullish reversal observed in the price trend.

Volume spikes coincide with price increases, suggesting possible institutional accumulation.

Support & Resistance

Strong support is observed around $56.00, where price previously rebounded.

Resistance is forming around $59.00, which could pose challenges for further upward movement.

Monitoring these levels can provide insights into potential price direction shifts.

Actionable Insights

Consider a buy strategy if the price breaks above the current resistance with strong volume.

Conversely, watch for sell signals if the price fails to break above and exhibits weakening momentum.

Bearish crossover in MACD and weakening volume are potential early indicators of a pullback.

The AI Technical Analysis Center is an informational tool only and does not constitute investment or trading advice.
This site is registered on wpml.org as a development site. Switch to a production site key to remove this banner.