Generic selectors
Exact matches only
Search in title
Search in content
Post Type Selectors

Popular stocks

Crypto

CFD

Currencies

Support

Gold

OIL – Technical Analysis – 4h

December 26, 2025 17:00

Quick Summary

The Crude Oil Futures chart indicates recent bearish pressure following a previous uptrend. Volume changes and significant candlestick patterns highlight this sentiment.

The asset’s current technical setup suggests caution is warranted, as key support and resistance levels will play a pivotal role in upcoming price movements.

Candlestick Analysis

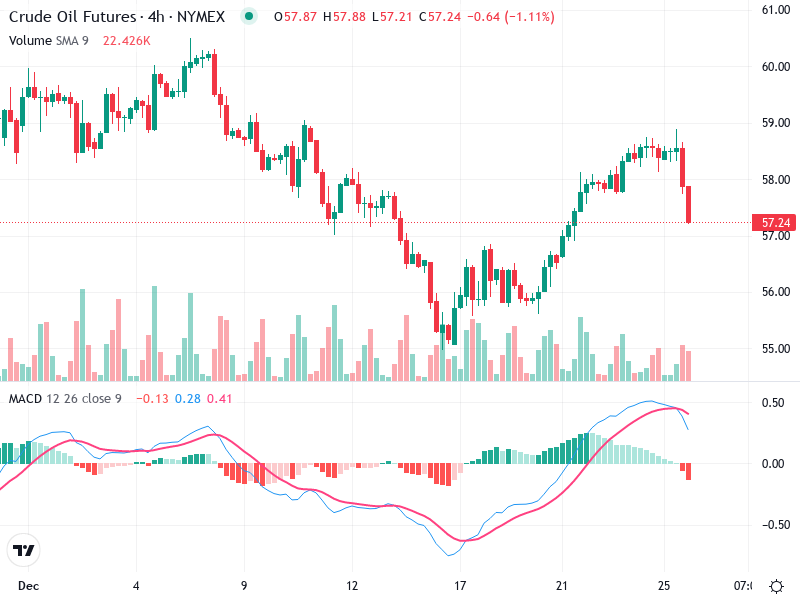
A pronounced bearish candlestick indicates strong selling pressure, suggesting a potential reversal after the previous uptrend.

The chart shows a transition period: an initial uptrend followed by a pullback, indicating a potentially bearish shift in the short term.

The level around 58-59 was a resistance zone the price recently pulled back from, indicating a failed breakout attempt.

MACD Analysis

A bearish crossover is evident with the MACD line crossing below the Signal line, suggesting weakening momentum.

The histogram is increasing in negative value, reinforcing the current bearish momentum.

There is no clear divergence at the moment; the MACD movement aligns with the recent price action.

Volume Analysis

Volume spiked along with the recent down move, supporting the bearish price action and suggesting conviction behind the selling.

The increased volume on the recent decline suggests that the downward move has substantial backing, possibly from institutional traders.

The spike in volume contrasts with previous sessions, highlighting increased activity during the decline.

Support & Resistance

Support zone: Around 56, where the price consolidated before the recent uptrend.

Resistance zone: Around 58.5 to 59, which the price failed to break through.

These levels are crucial; a breakdown below support might indicate further downside, while a breakthrough above resistance could suggest a resumption of the uptrend.

Actionable Insights

Consider selling or short positions if the price continues to break below support levels, confirming the bearish trend.

A buy signal might be warranted if there is a bullish reversal pattern near support with confirming volume.

Watch for confirmation of support around 56. Volume and candlestick patterns will be critical for identifying reversal or continuation of the downward movement.

The AI Technical Analysis Center is an informational tool only and does not constitute investment or trading advice.
This site is registered on wpml.org as a development site. Switch to a production site key to remove this banner.