Generic selectors
Exact matches only
Search in title
Search in content
Post Type Selectors

Popular stocks

Crypto

CFD

Currencies

Support

Gold

OIL – Technical Analysis – 4h

December 29, 2025 17:00

Quick Summary

This analysis presents insights on the technical aspects of the chart. It covers various indicators and patterns that have emerged recently.

The analysis provides a comprehensive view of the market sentiment and potential movement trends.

Candlestick Analysis

Recently, there's been a bullish engulfing pattern followed by upward movement, indicating bullish sentiment.

The trend shows a recent recovery from a bearish phase to a short-term bullish phase.

A breakout is observed above the $57 level, indicating potential strength.

MACD Analysis

The MACD line is above the Signal line, recently marking a bullish crossover.

The histogram is positive, indicating increasing bullish momentum.

No significant divergences observed between MACD and price action, confirming price strength.

Volume Analysis

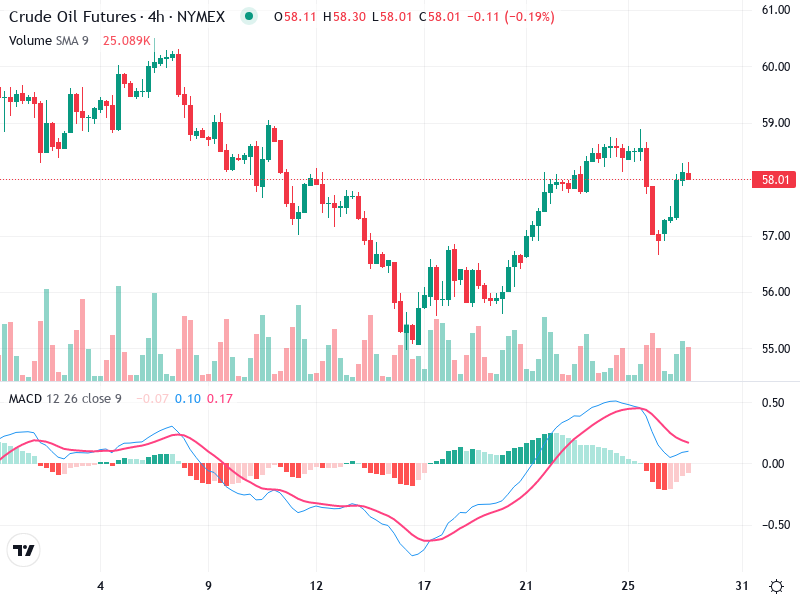
An increase in volume was evident during the recent price surge, supporting the bullish move.

Sustained volume supports the bullish breakout, indicating strong buying interest.

Prior to the upward move, volume spiked, suggesting potential institutional activity.

Support & Resistance

Key support is around $56, a recent bottom where buying pressure emerged.

Resistance is seen at $59, where the price recently faced selling pressure.

Breaking above $59 could further confirm the bullish trend continuation.

Actionable Insights

Consider buying on successful breakout and hold above $59 with confirmed volume.

Watch for potential reversals or a pullback near the $59 resistance.

Monitor for any bearish reversal patterns near resistance levels.

The AI Technical Analysis Center is an informational tool only and does not constitute investment or trading advice.
This site is registered on wpml.org as a development site. Switch to a production site key to remove this banner.