Generic selectors
Exact matches only
Search in title
Search in content
Post Type Selectors

Popular stocks

Crypto

CFD

Currencies

Support

Gold

OIL – Technical Analysis – 4h

January 1, 2026 17:00

Quick Summary

The chart for Crude Oil Futures indicates a cautious market sentiment amid fluctuating price actions. Over recent sessions, both bearish and bullish pressures have been in play, looking for direction.

Crude Oil Futures is currently caught within key support and resistance levels, showcasing potential trading opportunities.

Candlestick Analysis

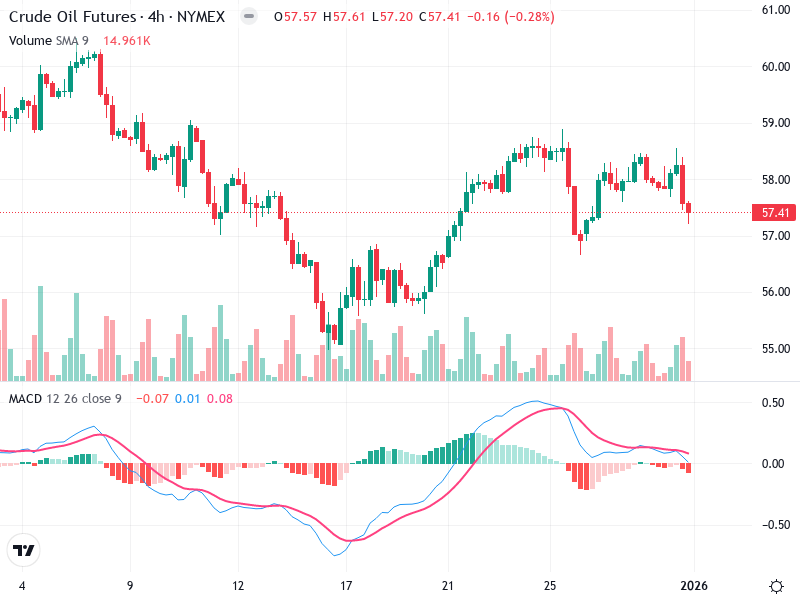
Currently, the chart shows a bearish candlestick, suggesting a continuation of downward momentum.

Earlier, there were several bearish patterns with red candlesticks clustered together, indicating potential selling pressure.

The trend appears to be sideways to bearish as price actions lack strong, sustained direction.

MACD Analysis

The MACD line is crossing below the signal line, indicating a bearish crossover and potential continued downside momentum.

The histogram bars are below the zero line and expanding, indicating increasing bearish momentum.

There doesn't appear to be any significant MACD divergence with the current price action.

Volume Analysis

Volume spikes are observed during price drops, supporting the downward movements.

Notably, increased volume during bearish pullback from recent highs affirms seller strength.

The spikes, especially during price declines, might hint at institutional selling.

Support & Resistance

The $56.50 to $57.00 range appears to act as a support zone, as price has bounced from these levels in the past.

Resistance is seen near the $58.00 level, where several attempts to break above have resulted in pullbacks.

Key levels remain crucial for future price movements.

Actionable Insights

Consider short positions if the price fails to break above $58.00 on increased volume.

Look for buying opportunities if the price finds support near $56.50 with signs of buying pressure and a bullish MACD crossover.

Monitor for confirmation of momentum change via MACD crossovers and volume increases at key levels.

The AI Technical Analysis Center is an informational tool only and does not constitute investment or trading advice.
This site is registered on wpml.org as a development site. Switch to a production site key to remove this banner.