Generic selectors
Exact matches only
Search in title
Search in content
Post Type Selectors

Popular stocks

Crypto

CFD

Currencies

Support

Gold

OIL – Technical Analysis – 4h

January 7, 2026 17:00

Quick Summary

This is a comprehensive technical analysis of Crude Oil Futures on a 4-hour time frame. The focus is on identifying critical patterns and trends that can guide future trading decisions.

The analysis is based on various aspects including candlestick patterns, MACD signals, volume changes, and support/resistance levels.

Candlestick Analysis

The overall trend observed in the chart is bearish. There is a noticeable series of lower highs and lower lows.

The recent large bearish candlestick indicates strong selling pressure. The presence of a small-bodied candle (possible doji) following the drop could suggest indecision, potentially hinting at a reversal or consolidation phase.

The chart shows a potential breakout zone around the $56.00 mark, where the price has tested lows multiple times.

MACD Analysis

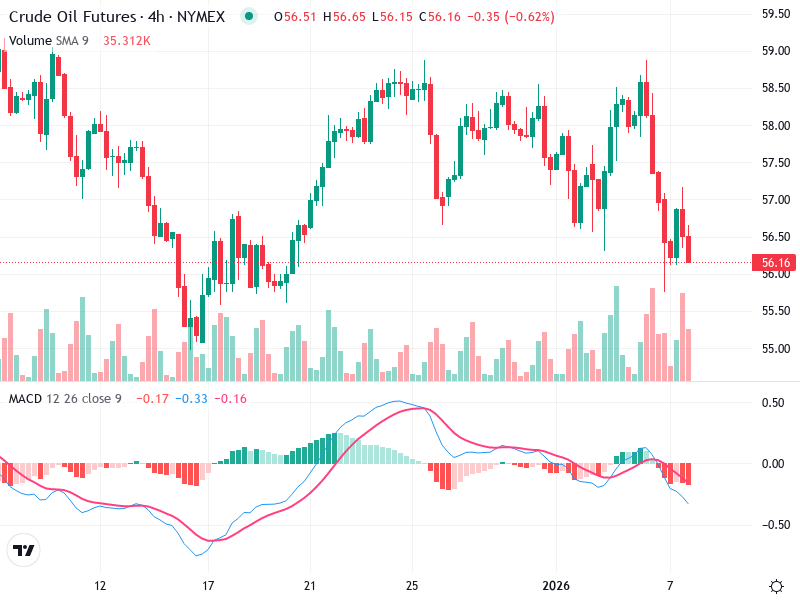
The MACD line is moving below the Signal line, indicating a bearish momentum. The bearish crossover confirms the selling pressure seen in the candlesticks.

The MACD histogram is in negative territory, supporting the bearish sentiment with growing bearish momentum.

There is no clear divergence between MACD and price action, reinforcing the current trend's strength.

Volume Analysis

There was a noticeable increase in volume accompanying the recent price drop, validating the strength of the downward move.

The rise in volume during the sell-off confirms seller dominance and reduces the likelihood of a false breakout.

The abrupt increase in volume indicates likely institutional activity, reinforcing bearish sentiment.

Support & Resistance

Key support lies around the $56.00 level, as observed from previous price action.

The immediate resistance level is around $57.00, where price faced selling pressure previously.

Breaking below the $56.00 support could lead to further downside, while holding could signal a reversal or consolidation.

Actionable Insights

Consider shorting if the price sustains below the $56.00 level, with a tight stop-loss above recent highs.

Look for buying opportunities only if a clear reversal pattern emerges with volume support.

Confirmation of a break below or a reversal above $56.00, paying close attention to volume and any reversal candlestick patterns.

The AI Technical Analysis Center is an informational tool only and does not constitute investment or trading advice.
This site is registered on wpml.org as a development site. Switch to a production site key to remove this banner.