Generic selectors
Exact matches only
Search in title
Search in content
Post Type Selectors

Popular stocks

Crypto

CFD

Currencies

Support

Gold

OIL – Technical Analysis – 4h

January 8, 2026 17:01

Quick Summary

The Crude Oil Futures chart displays signals of a potential bullish reversal. The series of recent green candles indicate buying pressure, supported by technical indicators.

Candlestick patterns and MACD movements further reinforce the likelihood of a bullish trend continuation.

Candlestick Analysis

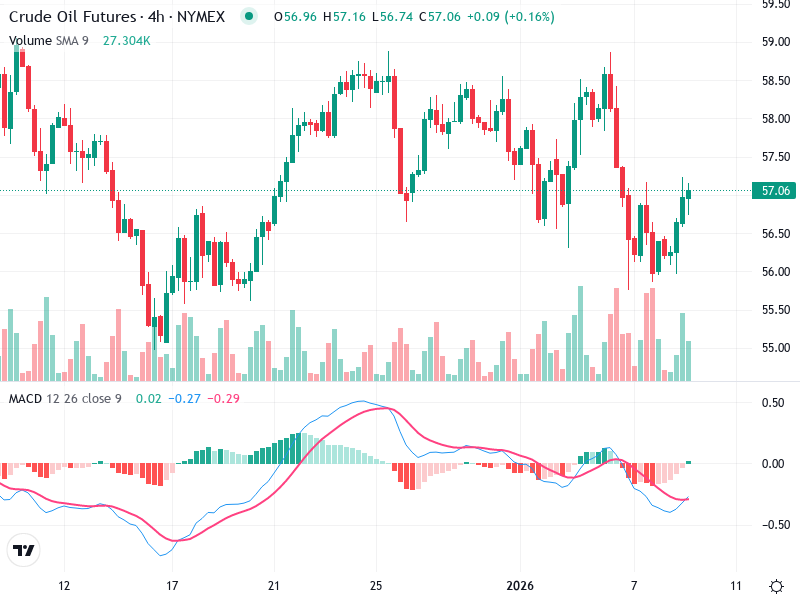
The recent candlestick formation suggests a potential bullish reversal with a series of green candles indicating buying pressure.

There is a prominent hammer followed by bullish candlesticks, hinting at a reversal from the recent downtrend.

The chart shows a sideways trend, with periodic shifts between bullish and bearish movements. Currently, there appears to be a minor bullish reversal off a previous support zone.

MACD Analysis

The MACD line (blue) is crossing above the Signal line (red), indicating a bullish crossover. This is often viewed as a buy signal.

The histogram has moved from negative to slightly positive, suggesting improving momentum in favor of the bulls.

There appears to be a bullish divergence between price action and the MACD, as the price forms a lower low but the MACD does not correspond with lower lows.

Volume Analysis

There's an increase in volume at the recent price lows, supporting the bullish reversal pattern.

This suggests that the recent buying interest is backed by strong volume.

The alignment of higher volume with bullish candlesticks supports the recent upward price actions.

Support & Resistance

Key support is around $56.50, as evidenced by the recent bounce.

A significant resistance level is near $57.50, where previous highs have been tested but not conclusively broken.

A breakout above the $57.50 level could signify a continuation of the bullish reversal, while a pullback might test support around $56.50.

Actionable Insights

Consider entering a position if the price breaks above $57.50 with strong volume, confirming the bullish reversal.

Set stop-loss slightly below the recent support at $56.50 to protect against downside risk.

Watch for closing prices above $57.50 and increased volume, which would strengthen the case for continued bullish momentum.

The AI Technical Analysis Center is an informational tool only and does not constitute investment or trading advice.
This site is registered on wpml.org as a development site. Switch to a production site key to remove this banner.