Generic selectors
Exact matches only
Search in title
Search in content
Post Type Selectors

Popular stocks

Crypto

CFD

Currencies

Support

Gold

OIL – Technical Analysis – 4h

January 12, 2026 17:01

Quick Summary

The analysis of Crude Oil Futures on the 4h chart suggests a bullish outlook. The price is showing upward momentum with higher highs and higher lows. Technical indicators are aligning with the positive sentiment.

Volume analysis confirms the strength of the bullish trend, indicating potential for further price increases.

Candlestick Analysis

The chart shows a bullish trend with higher highs and higher lows forming over the recent sessions.

A bullish engulfing pattern can be observed around the mid-section of the chart, indicating a potential reversal from a prior downtrend.

The price broke out above the resistance area around 58.00 and is currently testing higher resistance near 59.50.

MACD Analysis

The MACD line is above the Signal line, indicating bullish momentum. There is a bullish crossover which typically suggests upward price movement.

The positive MACD histogram bars are expanding, supporting the continuation of the current bullish trend.

No clear divergences observed at this time, aligning MACD momentum with price action.

Volume Analysis

An increase in volume was evident during the breakout around the 58.00 level, confirming the strength of the upward movement.

The rising volume supports the price increase, indicating healthy bullish sentiment.

There's a noticeable volume spike at the point of breakout and during subsequent pullbacks, suggesting possible institutional involvement.

Support & Resistance

Key support is established around 57.00, where the price previously consolidated before the breakout.

Resistance is observed near 59.50.

A clear break above this level could signal further upside potential.

Actionable Insights

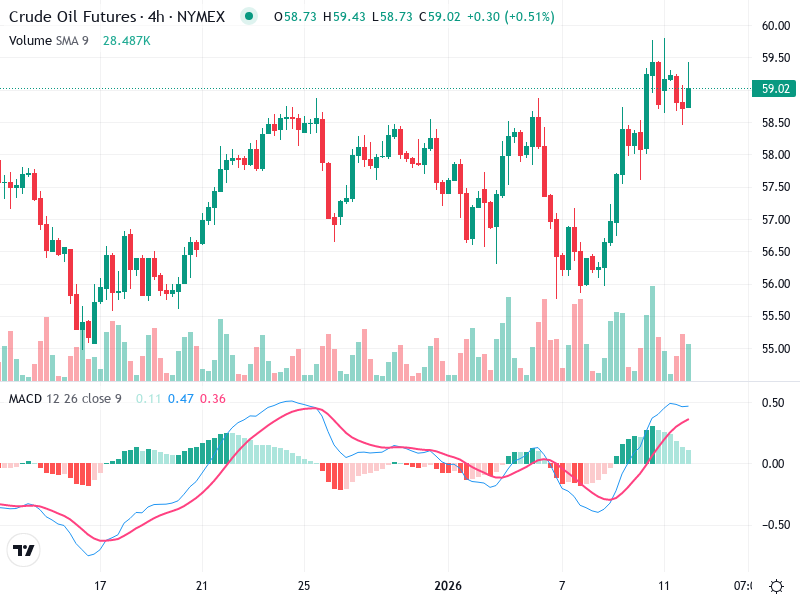
Consider buying if the price solidifies above the 59.50 resistance with strong volume support. Watching for a confirmed close above this level could bolster a long position.

If resistance at 59.50 holds and a bearish pattern emerges (e.g., a shooting star or bearish engulfing), a short-term sell might be warranted. Otherwise, holding could be beneficial to ride the trend.

Confirmation of breakout above 59.50 with volume increase, or signs of a potential reversal pattern at resistance.

The AI Technical Analysis Center is an informational tool only and does not constitute investment or trading advice.
This site is registered on wpml.org as a development site. Switch to a production site key to remove this banner.