Generic selectors
Exact matches only
Search in title
Search in content
Post Type Selectors

Popular stocks

Crypto

CFD

Currencies

Support

Gold

OIL – Technical Analysis – 4h

January 15, 2026 17:00

Quick Summary

The asset is showing signs of a shift from bullish to bearish sentiment. The recent analysis indicates a potential downtrend with significant bearish patterns observed in the charts. It’s crucial to monitor key levels for any signs of reversal or continuation.

Candlestick Analysis

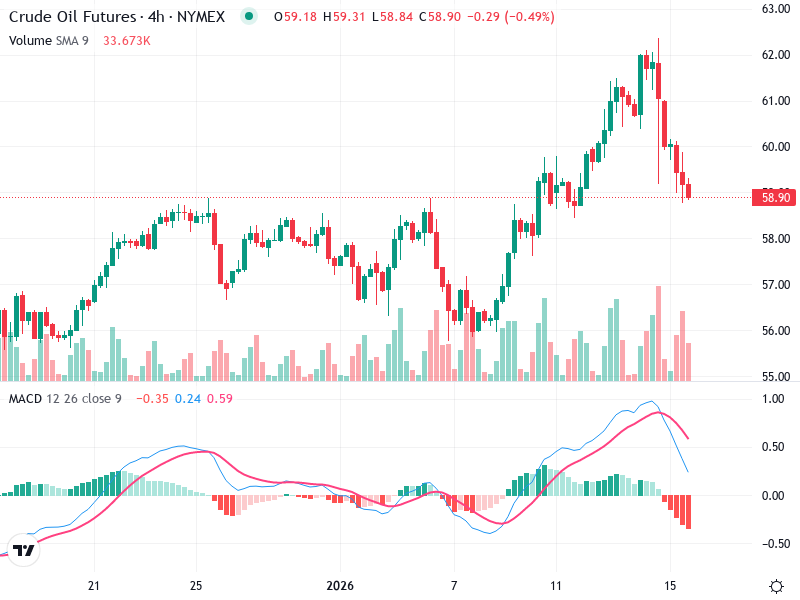
The overall trend appears to be shifting from bullish to bearish. Recently, there has been a significant downward movement.

A notable pattern is evident in the recent days where a bearish engulfing pattern emerged, indicating a potential reversal from a prior uptrend to a downtrend.

The current price is testing a potential support zone near the low 58 area, indicating the possibility of a pullback or further breakdown.

MACD Analysis

The MACD line has crossed below the Signal line, indicating a bearish crossover. This suggests increasing bearish momentum.

The MACD histogram shows negative values that are expanding, reinforcing the bearish sentiment and indicating momentum is increasing to the downside.

No clear divergence is observed between the MACD lines and price action at this moment.

Volume Analysis

There was a noticeable increase in volume during the recent decline, affirming the strength of the bearish move.

The volume considerably rises during significant price drops, which suggests that sellers are more active and could include institutional participation.

Support & Resistance

Key support is located near the 58.50 level. A decisive break below this could lead to further downside potential.

Resistance is likely around the recent high near 62, a level where sellers previously took control and pushed prices lower.

Actionable Insights

Traders considering a short position may want to look for a confirmation of the break below the support level with accompanying volume.

It might be prudent to wait for a potential bounce and subsequent test of the resistance level near 60-61 for a better risk/reward entry.

Consider reducing exposure or taking defensive action if the price decisively breaks below the key support at 58.50.

The AI Technical Analysis Center is an informational tool only and does not constitute investment or trading advice.
This site is registered on wpml.org as a development site. Switch to a production site key to remove this banner.