Generic selectors
Exact matches only
Search in title
Search in content
Post Type Selectors

Popular stocks

Crypto

CFD

Currencies

Support

Gold

OIL – Technical Analysis – 4h

January 16, 2026 17:01

Quick Summary

The Crude Oil Futures chart illustrates a dynamic market environment, with indications of bullish trends followed by possible consolidation phases. Key levels have been identified which may influence future price actions.

The asset currently displays potential for a bullish reversal, supported by previous price momentum and technical indicators.

Candlestick Analysis

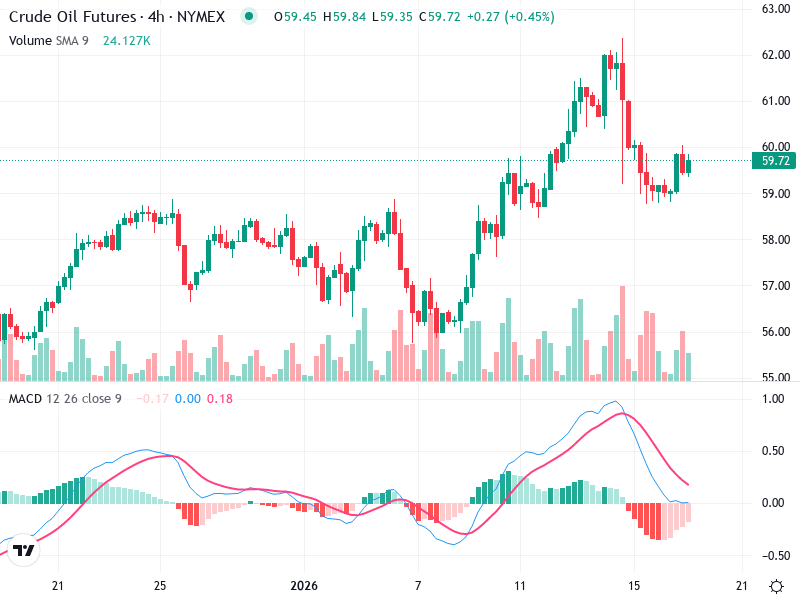
The overall trend on the chart appears bullish, particularly in the first half, followed by a correction and consolidation.

Near the recent peak, a bearish engulfing pattern is visible, indicating potential reversal, followed by a downward move.

The recent candlesticks show a potential hammer, suggesting possible support at this level.

MACD Analysis

The MACD line is below the Signal line, indicating bearish momentum.

The histogram bars are negative but decreasing, showing that bearish momentum is slowing down.

There is no clear divergence between the MACD and the price action currently observable.

Volume Analysis

Significant volume spikes are observed during the upward move, particularly during the breakout and peak near $61.00, indicating strong buying interest.

Recent lower volume suggests consolidation and less conviction in the current minor downtrend.

Around the peak and initial breakout zone, high volume suggests potential institutional activity and strong buying pressure.

Support & Resistance

Strong resistance is evident around the $62.00 mark.

Key support zone appears around $59.00, showing signs of holding strong as indicated by the potential hammer pattern in recent candles.

Actionable Insights

Consider buying if price action confirms the hammer with a bullish move and breaks above short-term resistance around $60.00 with increasing volume.

If the price breaks below $59.00 convincingly with increased volume, consider a selling strategy targeting $58.00 or lower.

Current consolidation suggests holding until a clear directional move is established.

The AI Technical Analysis Center is an informational tool only and does not constitute investment or trading advice.
This site is registered on wpml.org as a development site. Switch to a production site key to remove this banner.