Generic selectors
Exact matches only
Search in title
Search in content
Post Type Selectors

Popular stocks

Crypto

CFD

Currencies

Support

Gold

BTC/USD – Technical Analysis – 4h

September 8, 2025 07:04

Quick Summary

The Bitcoin /TetherUS 4-hour chart showcases a period of market indecision with the price oscillating within a specific range. The asset is currently testing critical support and resistance levels that could determine its next direction. Technical indicators hint at potential shifts in momentum, making it crucial for traders to stay vigilant.

Candlestick Analysis

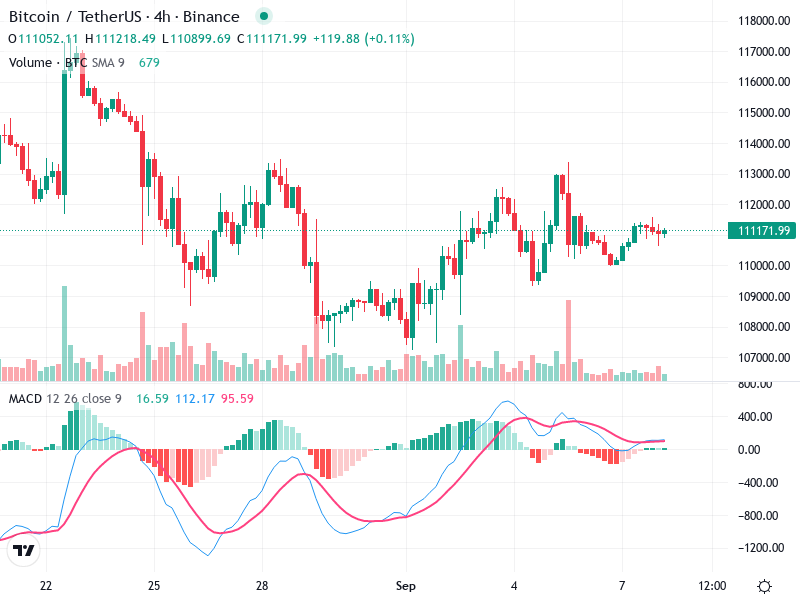
There is a combination of candlestick patterns like dojis and spinning tops recently, which often indicate indecision in the market.

Prior to this, there was a visible bullish engulfing pattern, providing a brief upward momentum.

The current trend appears to be sideways, with price oscillating between $11,050 and $11,300.

MACD Analysis

The MACD line is close to crossing above the Signal line, suggesting the potential for a bullish crossover.

The histogram is showing decreasing negative momentum, hinting at a possible shift towards bullish momentum.

There are no clear divergences at this time; the MACD reacts consistently with recent price movements.

Volume Analysis

Volume has been relatively stable with a slight increase during price movements.

The recent upward movement had some volume support, though not significant enough to suggest strong institutional backing.

The spikes in volume correspond to previous moderate price increases suggesting more retail than institutional participation.

Support & Resistance

Key support is around $11,050, which has been tested several times without breaking significantly.

Key resistance is around $11,300, a level that needs to be breached for a more substantial upward move.

Careful monitoring of price actions at these levels will provide clearer trading signals.

Actionable Insights

Consider buying if the price breaks above $11,300 with strong volume support and a bullish MACD crossover confirmation.

A break below $11,050 could present a selling opportunity, especially if accompanied by increasing bearish volume and a MACD bearish crossover.

Hold if the price remains within the $11,050 to $11,300 range without significant volume spikes or MACD changes.

The AI Technical Analysis Center is an informational tool only and does not constitute investment or trading advice.
This site is registered on wpml.org as a development site. Switch to a production site key to remove this banner.