Generic selectors
Exact matches only
Search in title
Search in content
Post Type Selectors

Popular stocks

Crypto

CFD

Currencies

Support

Gold

BTC/USD – Technical Analysis – 4h

September 10, 2025 07:04

Quick Summary

The asset’s chart shows an intriguing pattern, capturing the attention for potential shifts. Recent movements reveal subtle hints of emerging trends, making it a key observation.

Analyzing the asset can provide insights into potential opportunities.

Candlestick Analysis

The chart displays a variety of candlestick formations, lacking strong bullish or bearish engulfing patterns presently.

The trend appears slightly bullish but largely sideways, reflecting a consolidation range following a previous downtrend.

A breakout zone around 113,000 has been tested multiple times but remains unresolved, suggesting a consolidation phase due to frequent pullbacks.

MACD Analysis

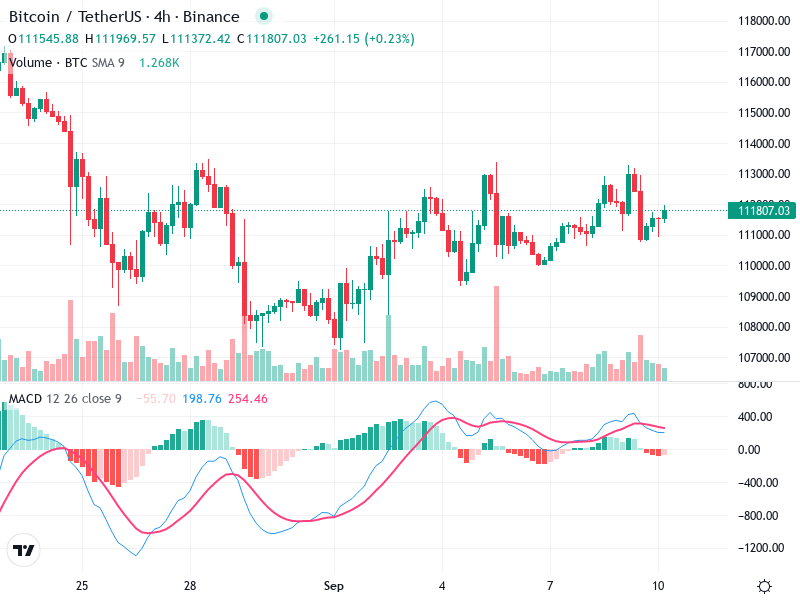
The MACD line recently crossed below the Signal line, indicating a bearish crossover, yet convergence towards a bullish crossover is observed.

The MACD histogram, though negative, shows signs of diminishing bearish momentum, hinting at a possible near-term reversal.

No significant divergences appear between the MACD and price action at this moment.

Volume Analysis

Volume spikes correspond with breakout attempts above resistance levels, though these are unsustained, indicating possible selling pressure.

The volume supports the consolidation phase, with fluctuating activity reflecting indecision.

Noticeable volume activity on failed breakouts isn't substantial enough to suggest major institutional moves.

Support & Resistance

Key support is around 111,000, where recent price action bounced back.

Key resistance is around 113,000, tested multiple times without a successful breakout.

These levels are crucial for potential reversals; significant movement beyond could indicate trend continuation or reversal.

Actionable Insights

Consider buying if the price decisively breaks above 113,000 with strong volume confirming the breakout.

Look to sell if support at 111,000 is breached with increasing volume, as this could signal further downtrend.

Holding is advisable without decisive movement, with a focus on monitoring the consolidation range.

The AI Technical Analysis Center is an informational tool only and does not constitute investment or trading advice.
This site is registered on wpml.org as a development site. Switch to a production site key to remove this banner.