Generic selectors
Exact matches only
Search in title
Search in content
Post Type Selectors

Popular stocks

Crypto

CFD

Currencies

Support

Gold

BTC/USD – Technical Analysis – 4h

September 15, 2025 07:04

Quick Summary

The BTC/USDT chart depicts a generally bullish trend with recent bullish momentum solidifying around key resistance levels. The asset is navigating potential breakout scenarios, supported by technical indicators and volume.

Overall sentiment remains cautiously optimistic with potential for continued upward movement if resistance levels are decisively breached.

Candlestick Analysis

The chart displays a bullish trend with higher highs and higher lows since the beginning of September.

A bearish engulfing pattern appeared near the recent peak, indicating potential short-term selling pressure. A consolidation phase followed, which seems to have resolved upward with a recent bullish candle that closed near the highs.

The recent bullish candle broke previous resistance around 115,500, signaling potential further upside.

MACD Analysis

The MACD line is below the Signal line, suggesting a recent bearish crossover. However, the lines are close, indicating the potential for a bullish reversal if price action supports.

The histogram shows diminishing negative momentum, which could indicate weakening bearish pressure and a potential bullish reversal.

Currently, no clear divergence is noted between price and MACD.

Volume Analysis

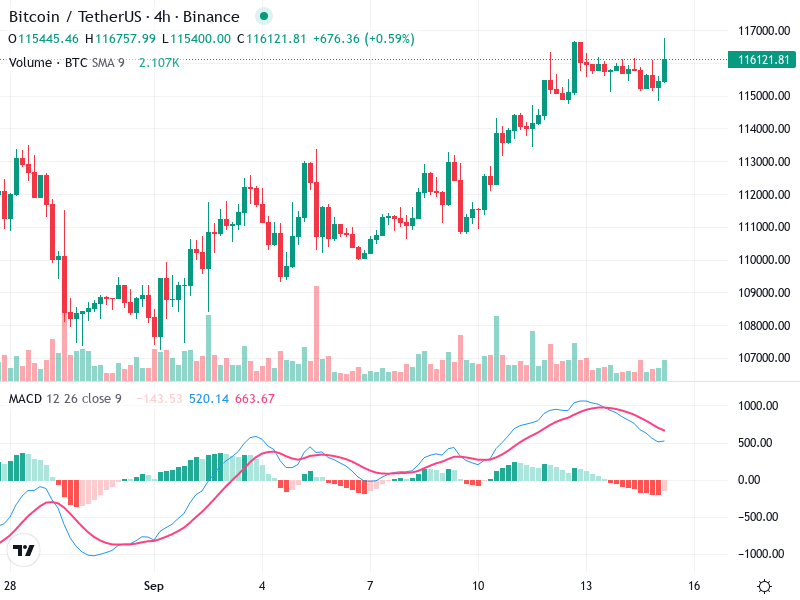
There was a noticeable increase in volume during recent bullish movements, supporting the price advance. However, volumes have tapered during pullbacks, indicating a lack of strong selling pressure.

The previous spikes in volume suggest possible institutional accumulation during consolidation near support levels.

Volume trends underline the bullish sentiment, providing backing for upward movement, especially during breakouts.

Support & Resistance

Key support is observed around 113,000, where previous consolidations and volume accumulation occurred.

Immediate resistance is at 116,500. A breakout above this level could bring further gains, testing higher resistance levels.

The interplay of support and resistance levels will be critical in gauging near-term price action.

Actionable Insights

Consider buying on confirmation of a bullish MACD crossover or a strong close above the 116,500 resistance level, supported by volume.

Cautious traders might wait for confirmation due to the recent bearish crossover in MACD. Holding might be appropriate unless price falls below 113,000 support.

Monitor for a close below support at 113,000, which could signal a reversal in trend.

The AI Technical Analysis Center is an informational tool only and does not constitute investment or trading advice.
This site is registered on wpml.org as a development site. Switch to a production site key to remove this banner.