Generic selectors
Exact matches only
Search in title
Search in content
Post Type Selectors

Popular stocks

Crypto

CFD

Currencies

Support

Gold

BTC/USD – Technical Analysis – 4h

September 24, 2025 07:04

Quick Summary

The Asset chart reveals intricate market dynamics with potential shifts.

The analysis considers various indicators, suggesting possible future movements.

Overall, the Asset’s current market sentiment suggests cautious observation.

Candlestick Analysis

The chart initially shows a bullish trend with higher highs and higher lows leading up to a peak, followed by a bearish reversal forming lower lows and lower highs.

The sudden large bearish candle suggests strong selling pressure, but recent smaller bullish candlesticks indicate a potential stabilization or reversal.

The recent price action suggests a pullback from the previous support zone around 112,000 which is now acting as resistance.

MACD Analysis

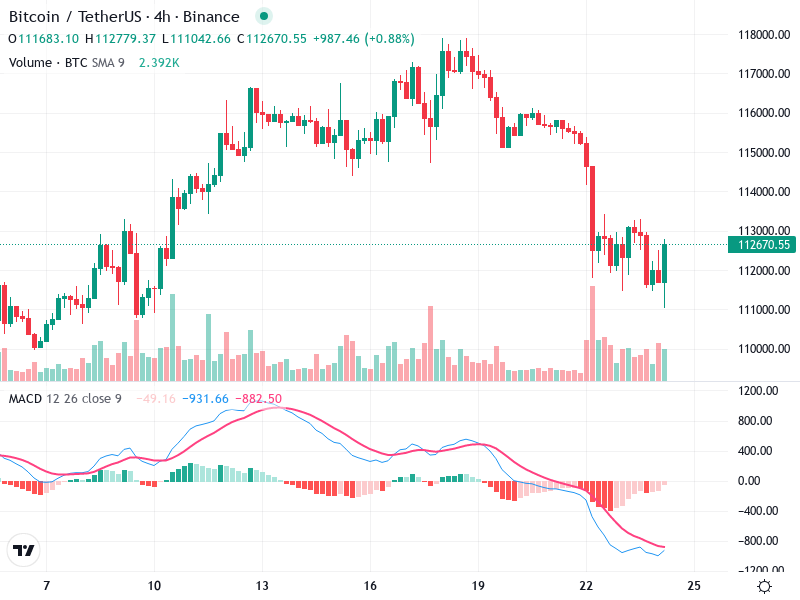
The MACD line is below the Signal line, indicating a current bearish phase, but the lines are converging which might suggest reducing bearish momentum.

Recent histogram bars show diminishing bearish momentum, which could indicate a potential trend reversal or at least a temporary stabilization.

No clear divergences are visible at present, but watch for a bullish crossover as a sign for a potential upward move.

Volume Analysis

There was a notable spike in volume during the recent large bearish move, suggesting institutional selling or panic selling.

Recent bars show decreasing volume on bullish attempts, indicating a lack of strong buying pressure currently.

The spike in volume on the downward move could indicate significant activity, potentially marking a capitulation phase.

Support & Resistance

Support is around 111,000 where previous lows have been observed.

Resistance is currently around 112,700 to 113,000 where price has met resistance recently.

Breaking and holding above the resistance may confirm bullish momentum, failing which can suggest a continued downward trend or sideways movement.

Actionable Insights

Consider a hold strategy until more definitive signals are available, especially a bullish crossover on the MACD and stronger volume on upward moves.

A break above 113,000 with strong volume could indicate a buy opportunity.

If support around 111,000 is broken, it could be a signal for a sell or to enact tighter stop losses.

The AI Technical Analysis Center is an informational tool only and does not constitute investment or trading advice.
This site is registered on wpml.org as a development site. Switch to a production site key to remove this banner.