Generic selectors
Exact matches only
Search in title
Search in content
Post Type Selectors

Popular stocks

Crypto

CFD

Currencies

Support

Gold

BTC/USD – Technical Analysis – 4h

September 25, 2025 07:04

Quick Summary

The 4-hour chart of Bitcoin against TetherUS reveals compelling insights for technical traders. The asset has been showing signs of bearish momentum, affecting broader market sentiment. Key levels of support and resistance play a crucial role in guiding strategic decisions.

Candlestick Analysis

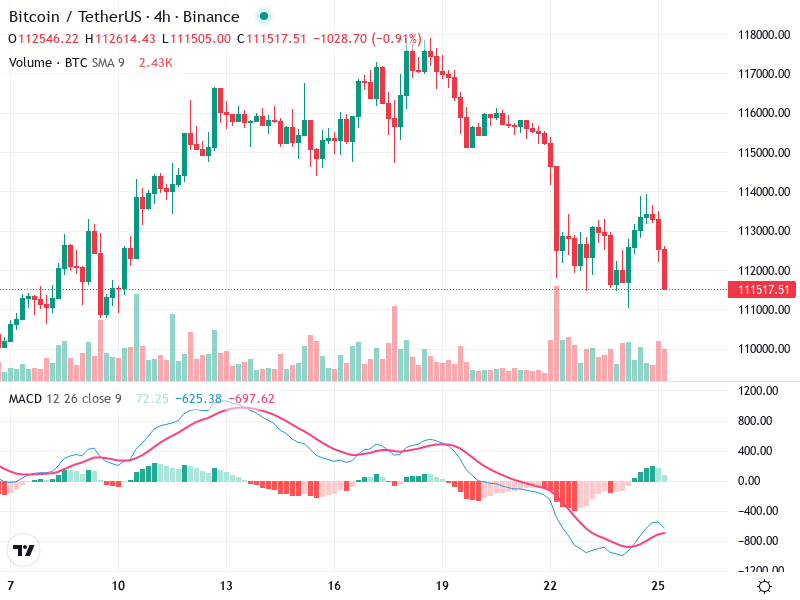
Recently, there is a noticeable bearish candlestick pattern, suggesting a continuation of the downward trend from the recent high.

Near the end of the chart, there appears to be a potential hammer forming, indicating a possible short-term support zone.

The overall trend is bearish, following a series of lower highs and lower lows.

MACD Analysis

The MACD line is below the Signal line, confirming the bearish momentum.

Recent attempt at a bullish crossover but was unable to sustain, further supporting the bearish sentiment.

The histogram shows increasing negative values, underscoring the continuation of bearish momentum.

Volume Analysis

Volume shows spikes during price drops, indicating strong selling pressure and possibly panic selling.

Lack of volume support on upward movements, suggesting weak bullish attempts.

Large volume spikes could suggest institutional selling or significant retail panic, particularly around resistance areas.

Support & Resistance

Immediate support is around 111,000 USDT where current price is hovering.

Further support may be near 110,000 USDT, which could act as a psychological level.

Key resistance is at the previous breakout level of around 113,000 USDT.

Actionable Insights

Given the bearish trend and momentum, short positions or sell strategies could be considered.

Conservative traders may wait for a confirmed bullish signal, such as a MACD crossover or a strong reversal pattern, before entering long positions.

Watch for a bounce from the current support level around 111,000 USDT.

The AI Technical Analysis Center is an informational tool only and does not constitute investment or trading advice.
This site is registered on wpml.org as a development site. Switch to a production site key to remove this banner.