Generic selectors
Exact matches only
Search in title
Search in content
Post Type Selectors

Popular stocks

Crypto

CFD

Currencies

Support

Gold

BTC/USD – Technical Analysis – 4h

September 29, 2025 07:05

Quick Summary

This technical analysis provides insights into the current trends and potential future movements of Bitcoin /TetherUS on the 4-hour chart. The analysis covers various technical indicators including candlestick patterns, MACD, volume, and support/resistance levels, offering a comprehensive view of the market dynamics.

Recent activity suggests a shift in momentum with notable patterns and volume changes indicating potential bullish behavior. It’s crucial to analyze these elements to assess the likelihood of sustained movements.

Candlestick Analysis

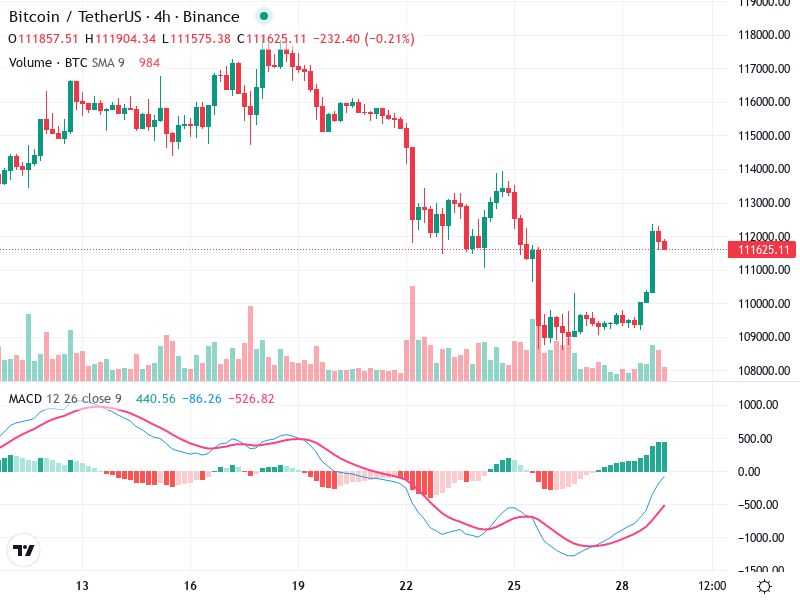
A significant bullish engulfing pattern appeared recently, suggesting potential upward momentum for Bitcoin/TetherUS. This was succeeded by smaller, bullish candles.

The overall trend seems to be shifting from bearish to bullish, particularly after recent price actions indicating a reversal.

A breakout past the $111,000 resistance level occurred, with prices pulling back slightly, possibly to test this level as new support.

MACD Analysis

The MACD line has crossed above the Signal line, serving as a bullish indicator.

The MACD histogram is expanding positively, implying increasing bullish momentum.

No clear divergences are observed between the MACD and price action, supporting the current upward trend.

Volume Analysis

There was a noticeable surge in volume during the recent bullish breakout, indicating strong buying interest.

The price increase aligns with volume changes, strengthening the possibility of sustained movement.

The unusual volume spikes during the breakout may suggest institutional buying or heightened market interest.

Support & Resistance

The $111,000 level is crucial as a new support line post-breakout.

Immediate resistance is anticipated around the $113,000 to $114,000 range based on prior peaks.

Staying above $111,000 could lead to higher resistance level tests, while dropping below might indicate further consolidation or a bearish reversal.

Actionable Insights

Consider buying if the price stabilizes above the $111,000 support confirmed by strong volume.

Exercise caution near the $113,000-$114,000 zone; think about selling if the price can't break this resistance and volume decreases.

If holding, monitor the $111,000 support for signs of strength or weakness to inform your decision-making.

The AI Technical Analysis Center is an informational tool only and does not constitute investment or trading advice.
This site is registered on wpml.org as a development site. Switch to a production site key to remove this banner.