Generic selectors
Exact matches only
Search in title
Search in content
Post Type Selectors

Popular stocks

Crypto

CFD

Currencies

Support

Gold

BTC/USD – Technical Analysis – 4h

October 6, 2025 07:04

Quick Summary

The technical analysis of the asset indicates bullish trends supported by recent price actions. The asset has experienced a breakout past significant resistance levels.

The volume increase during price surge and notable MACD positions suggest potential continued upside.

Candlestick Analysis

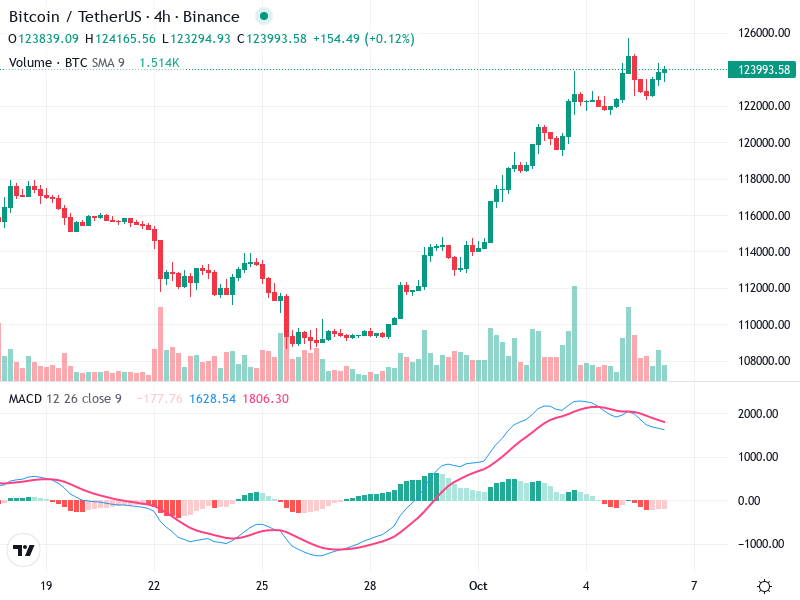
The overall trend is bullish, with a series of higher highs and higher lows.

Recently, there are bullish patterns such as green candles with strong wicks at the bottom, suggesting buying pressure.

Prices have broken above a previous resistance around 120,000, which may now act as support.

MACD Analysis

The MACD line is above the Signal line, indicating a bullish crossover. However, they appear to be converging, which may signal potential slowing momentum.

The histogram showed decreasing bars recently, suggesting waning bullish momentum.

No clear divergence between MACD and price action is evident.

Volume Analysis

There was a significant increase in volume accompanying the recent price surge, supporting the bullish breakout.

Recent pullback in price has been on lower volume, which is typical in a correction phase following a strong rally.

A large spike in volume can be noticed during the initial breakout, potentially indicating institutional buying.

Support & Resistance

120,000 is a key support level after the recent breakout.

The next resistance level appears near 126,000, where price experienced consolidation previously.

These levels are critical as breaking below support may lead to a deeper correction, while a breakout above resistance could resume the uptrend.

Actionable Insights

Consider buying if the price holds above the 120,000 support with increasing volume as confirmation.

Watch for a bearish crossover in the MACD as a sell signal if the price falls below support.

If holding, look for continued bullish volume and confirmation of resistance break.

The AI Technical Analysis Center is an informational tool only and does not constitute investment or trading advice.
This site is registered on wpml.org as a development site. Switch to a production site key to remove this banner.