Generic selectors
Exact matches only
Search in title
Search in content
Post Type Selectors

Popular stocks

Crypto

CFD

Currencies

Support

Gold

BTC/USD – Technical Analysis – 4h

October 7, 2025 07:04

Quick Summary

The chart shows a notable bullish trend characterized by a series of higher highs and higher lows. Recent signals indicate potential challenges to the current direction, suggesting careful monitoring of key levels is necessary.

The analysis highlights areas of interest that could determine future price action for .

Candlestick Analysis

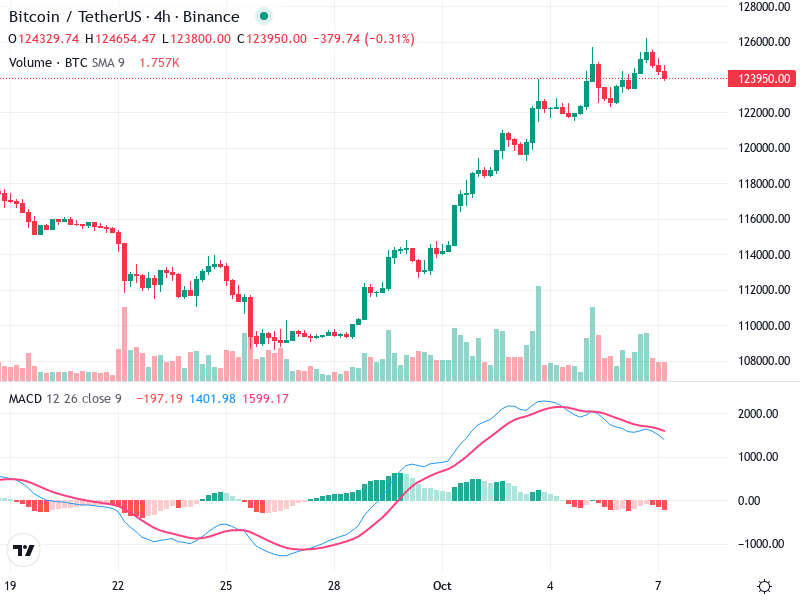
The chart exhibits a clear bullish trend, with consistent higher highs and higher lows reinforcing upward momentum.

Recently, a minor red candlestick has appeared atop several green candlesticks, hinting at a possible pause or minor pullback.

Potential pullback levels observed include 123,950, with established support around the 122,000 mark.

MACD Analysis

The MACD line resides above the Signal line but shows signs of convergence, hinting at a weakening momentum.

The histogram's decreasing positive momentum suggests potential bearish opportunities as it continues to diminish.

The absence of MACD divergence confirms the current trend but highlights a need for caution due to slowing momentum.

Volume Analysis

The recent bullish movement was accompanied by increased volume, now slightly diminishing as buying interest wanes.

Past volume supports the upward price trajectory, but recent volume decline suggests a lack of strong buying conviction.

No significant institutional activity detected, but past volume spikes coincided with price increases.

Support & Resistance

Key support is located around 122,000, acting previously as resistance and signaling potential buying interest.

Immediate resistance identified near 126,500, with the inability to break higher suggesting a possible pullback.

Failure to surpass resistance might confirm a pullback if support at 122,000 is tested.

Actionable Insights

Consider buying on support confirmation at 122,000, looking for potential retests of recent highs.

A bearish crossover in MACD and a drop below 122,000 support could signal a selling opportunity.

Current holders may choose to wait for price stabilization above support, observing for reversal or trend continuation indications.

The AI Technical Analysis Center is an informational tool only and does not constitute investment or trading advice.
This site is registered on wpml.org as a development site. Switch to a production site key to remove this banner.