Generic selectors
Exact matches only
Search in title
Search in content
Post Type Selectors

Popular stocks

Crypto

CFD

Currencies

Support

Gold

BTC/USD – Technical Analysis – 4h

October 8, 2025 07:04

Quick Summary

The Bitcoin /TetherUS 4-hour chart illustrates recent market movements, highlighting a transition from a bullish trend with some bearish signals emerging. This analysis reviews key technical indicators to assess the current dynamics of this asset.

Bitcoin /TetherUS demonstrates signs of potential consolidation, making it crucial to observe support and resistance levels for strategic trading decisions.

Candlestick Analysis

Recently, there is a bearish candlestick pattern marked by a red candle, indicating a potential reversal or pullback after a bullish trend.

No immediate doji or hammer patterns observed, which typically indicate indecision or reversals.

The chart shows a strong bullish trend from late September into early October. However, the formation of multiple red candlesticks recently suggests potential consolidation or a minor pullback.

MACD Analysis

There is a bearish crossover where the MACD line crosses below the Signal line, indicating potential bearish momentum.

The histogram shows increasing red bars, reinforcing the bearish sentiment as momentum wanes.

No clear divergences observed between MACD and price action on this 4-hour chart.

Volume Analysis

Volume spikes are noted during recent price peaks, suggesting a potential distribution phase or profit-taking by traders.

The increased volume during price declines could indicate stronger selling pressure, aligning with the price pullback.

Enhanced volume during the price peak indicates potential institutional activity or heightened trader interest.

Support & Resistance

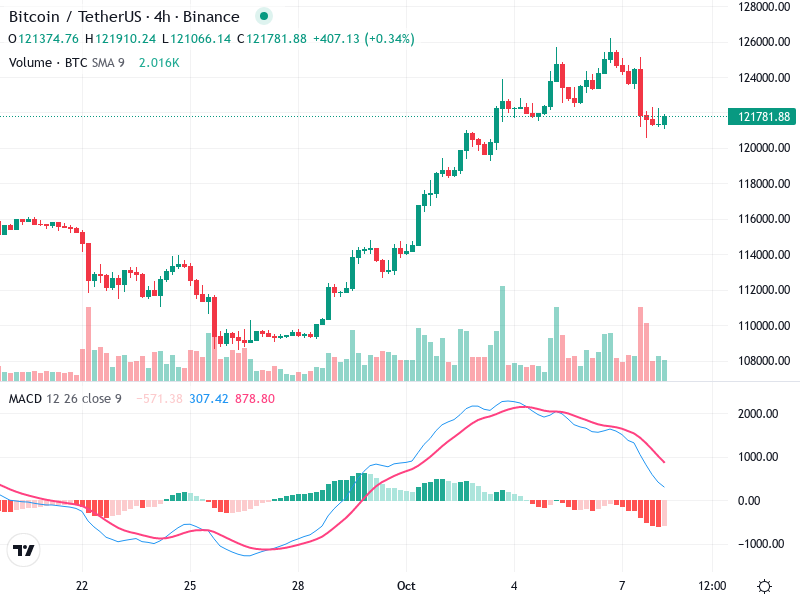
Around 120,000 acts as a temporary support zone, aligning with previous consolidation points.

Resistance is noted around 124,000, as prices have tested and retraced from this level.

The recent price levels around 122,000 show signs of rejection, acting as a temporary resistance.

Actionable Insights

Hold/Wait: Current signals suggest caution. Await confirmation of support around 120,000 before considering new entries.

Sell: If price fails to maintain 120,000 with increased volume, a short position may be viable.

Watch for support level testing around 120,000 to confirm a potential bounce.

The AI Technical Analysis Center is an informational tool only and does not constitute investment or trading advice.
This site is registered on wpml.org as a development site. Switch to a production site key to remove this banner.