Generic selectors
Exact matches only
Search in title
Search in content
Post Type Selectors

Popular stocks

Crypto

CFD

Currencies

Support

Gold

BTC/USD – Technical Analysis – 4h

October 9, 2025 07:04

Quick Summary

The asset chart demonstrates key technical elements that provide insight into future price movements. The current analysis focuses on different technical indicators to assess the overall market trend. Observing these indicators helps in forming potential trading strategies for the asset.

Candlestick Analysis

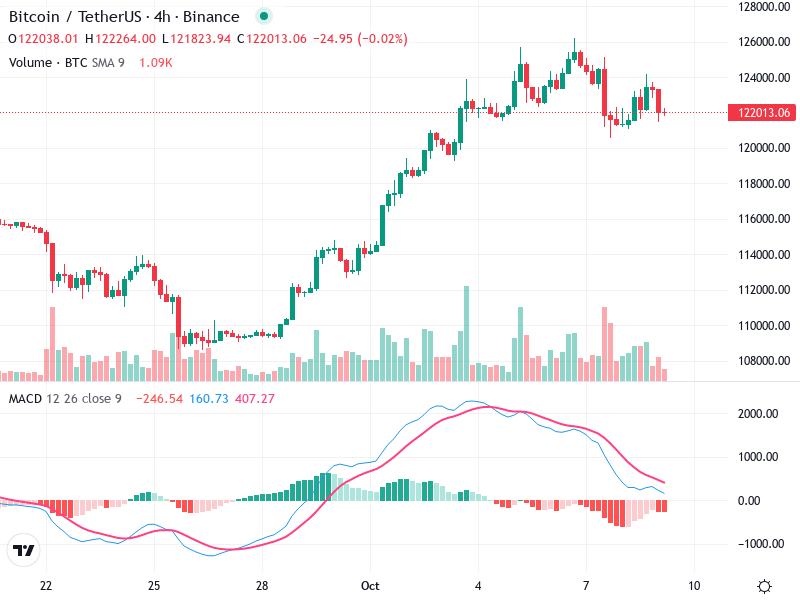
The chart shows an overall bullish trend leading up to the current point, with a noticeable uptrend from the bottom at the end of September.

There are no distinct reversal candlestick patterns presently. Recent candles indicate indecision as evidenced by small real bodies, suggesting a potential pause or reversal moment.

The price has pulled back after hitting resistance around 126,000, indicating a potential consolidation zone.

MACD Analysis

The MACD line has crossed below the Signal line, indicating a bearish crossover, which typically signals a potential downtrend or correction.

The histogram is showing negative bars, which suggests decreasing bullish momentum.

There are no clear divergences between MACD and the price action, aligning the recent price pullback with the declining momentum.

Volume Analysis

Volume spikes were observed during the initial uptrend, supporting the price increase. However, volume has declined during the recent consolidation, which can indicate a lack of strong selling pressure.

Institutional Activity: No clear signs of abnormal volume that would suggest significant institutional moves recently.

Support & Resistance

Strong resistance is around 126,000, confirmed by the pullback from this area.

Immediate support seems to be around the 120,000 level, where the price is currently hovering.

Watching the 120,000 level for holding support is crucial for any potential rebound.

Actionable Insights

Consider holding or reducing positions until a clearer trend is established. A break above 126,000 could signal a buying opportunity, while a drop below 120,000 might suggest selling.

Look for confirmation signals such as high-volume breakouts of current support/resistance levels for future positions.

Market sentiment appears cautious given the indecision in recent candlestick formations and the bearish MACD crossover.

The AI Technical Analysis Center is an informational tool only and does not constitute investment or trading advice.
This site is registered on wpml.org as a development site. Switch to a production site key to remove this banner.