Generic selectors
Exact matches only
Search in title
Search in content
Post Type Selectors

Popular stocks

Crypto

CFD

Currencies

Support

Gold

BTC/USD – Technical Analysis – 4h

October 10, 2025 07:05

Quick Summary

The chart of shows a clear consolidation phase with key levels at play. The asset demonstrates potential support and resistance that could define future movements. Traders should keep an eye on these levels to gauge possible breakouts or breakdowns.

Candlestick Analysis

The candlestick patterns reveal a mix of indecision candles like dojis and some small-bodied candles, indicating potential hesitation in the market.

The overall trend appears to have been bullish, with a significant upward movement before entering a sideways consolidation phase.

The price seems to hover around the 121,000 level, suggesting this could be a potential support or pullback zone.

MACD Analysis

The MACD line is below the Signal line, indicating bearish momentum. There's a potential for a crossover if the MACD begins to rise.

The histogram is in negative territory, suggesting weakening momentum. However, the decreasing size of the histogram bars may indicate diminishing bearish momentum.

No clear divergence is observed between the MACD and the price action currently.

Volume Analysis

Volume has been relatively stable with some spikes during price increases and decreases, suggesting participation but not a strong conviction.

The volume does not strongly support the current sideways movement, indicating a lack of strong buyer or seller interest.

Earlier, significant volume spikes correlated with price increases, suggesting some level of institutional or informed trading activity.

Support & Resistance

The area around 120,000 appears to be a key support level, evidenced by previous bounces.

Resistance is visible at approximately 124,000, where the price previously reversed downward.

A breakout above recent highs or a drop below recent lows could indicate the next move.

Actionable Insights

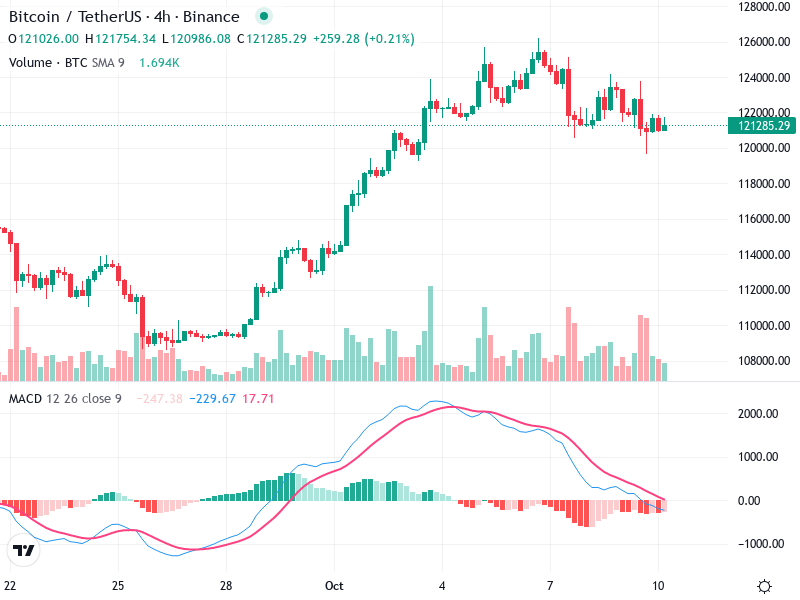
Consider buying if the price breaks above 124,000 with strong volume confirmation, indicating renewed bullish momentum.

A sell might be warranted if the price breaks below 120,000 with accompanying high volume, as a bearish trend could develop.

Holding might be advisable as the price remains in the current range, awaiting clearer directionality.

The AI Technical Analysis Center is an informational tool only and does not constitute investment or trading advice.
This site is registered on wpml.org as a development site. Switch to a production site key to remove this banner.