Generic selectors
Exact matches only
Search in title
Search in content
Post Type Selectors

Popular stocks

Crypto

CFD

Currencies

Support

Gold

BTC/USD – Technical Analysis – 4h

October 17, 2025 07:04

Quick Summary

The Bitcoin /TetherUS chart exhibits notable trends with clear bearish signs. Observations suggest a strong sell-off, marked by significant price actions and technical indicators.

The asset’s movement patterns reveal key insights into potential future directions.

Candlestick Analysis

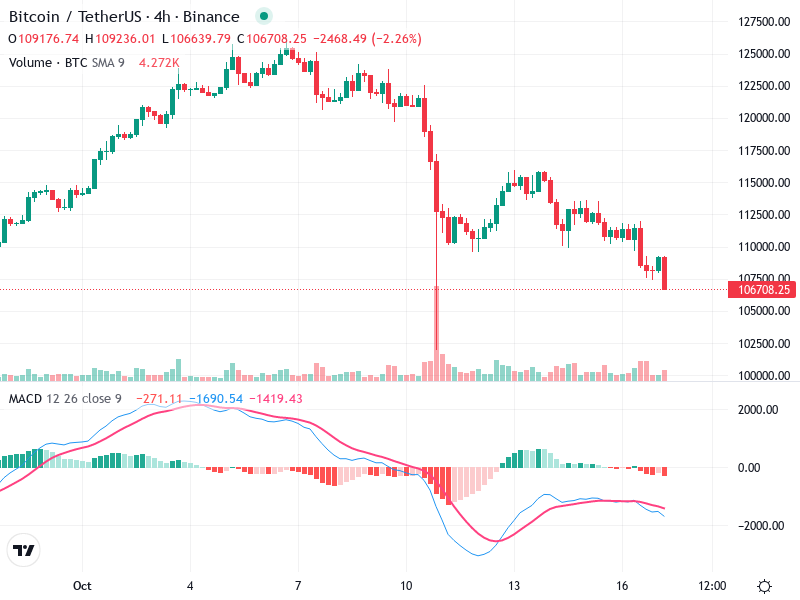
The chart shows a strong bearish trend, with a significant downward movement evident, especially from the peak around early October.

A noticeable drop occurred following bearish candlestick formations, including long red candlesticks indicating strong selling pressure.

There appears to be a breakdown below the 112,000 level, which acted as a prior support, now serving as resistance.

MACD Analysis

The MACD line is below the Signal line, which suggests a bearish crossover signaling continued downward momentum.

The histogram has been negative, supporting the bearish sentiment, though there appears to be slight easing, indicating momentum loss.

No clear divergences observed as the price action aligns with MACD's bearish momentum.

Volume Analysis

There is a significant volume spike corresponding with the large downward price movement, indicating strong selling pressure, likely institutional involvement.

Volume supports the recent bearish moves, aligning with the downward price trend.

Overall, the volume trend reflects the market's bearish nature.

Support & Resistance

Currently, the price approaches the 105,000 level, an important psychological and technical support, where previous rebounds have occurred.

Resistance seen around 112,000 due to the breakdown level and previous consolidation.

Watch closely how it interacts with these key levels for further indications.

Actionable Insights

Cautious buyers should wait for confirmation of reversal signs near the 105,000 support level or a bullish MACD crossover before considering entry.

Sellers might consider capitalizing on any rallies back towards resistance zones around 112,000, as long as the bearish trend persists.

Those holding positions should monitor the 105,000 level closely, as a break below could indicate further downside risk.

The AI Technical Analysis Center is an informational tool only and does not constitute investment or trading advice.
This site is registered on wpml.org as a development site. Switch to a production site key to remove this banner.