Generic selectors
Exact matches only
Search in title
Search in content
Post Type Selectors

Popular stocks

Crypto

CFD

Currencies

Support

Gold

BTC/USD – Technical Analysis – 4h

October 22, 2025 07:04

Quick Summary

The chart analysis for shows a complex interplay of market forces. Recent sessions have displayed potential reversals and persistent trends that traders should be aware of. Overall, the sentiment is cautious, with a need to closely monitor key levels.

Candlestick Analysis

Notable presence of a bearish engulfing pattern in the recent sessions indicates a potential reversal in the short-term uptrend.

Overall, the current trend seems sideways with a bearish tilt due to the recent sharp drop and rejection at higher levels.

The four-hour chart displays a slight bearish bias with attempts to rally being met with strong selling pressure.

MACD Analysis

The MACD line is crossing below the Signal line, signaling a bearish crossover which suggests downward momentum.

The histogram shows declining bullish momentum, indicating weakening buying pressure.

There is no clear divergence between MACD and price action currently; both are showing a bearish inclination.

Volume Analysis

Volume saw a significant spike during the recent price drop, indicating strong selling activity, likely contributing to the bearish candlestick formation.

The increased volume on the price decrease supports the bearish sentiment, validating the downtrend movement post-failed breakout.

Unusual volume spikes suggest potential institutional selling activity, aligning with the price drop.

Support & Resistance

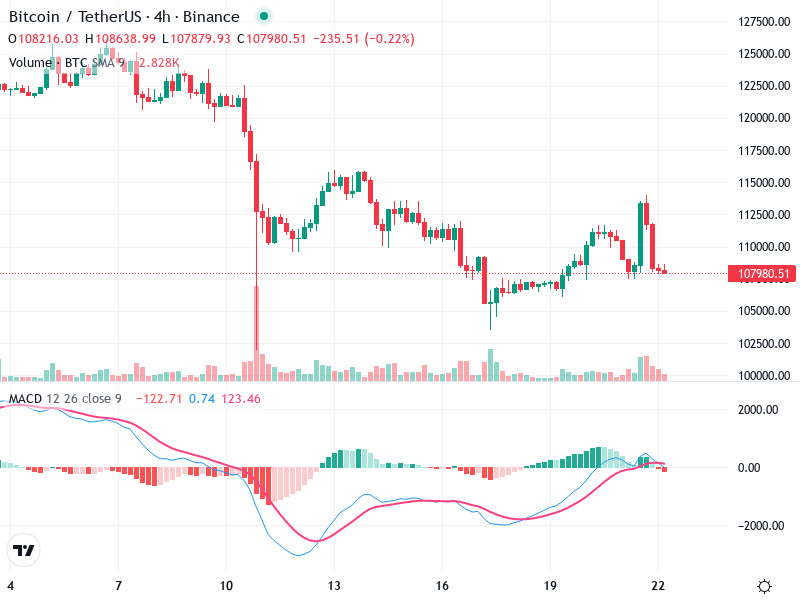
Key support level appears around the 105,000 mark; any breakdown below this could exacerbate the bearish sentiment.

Resistance is strong at around 112,000, as observed from the recent rejection, further asserting its validity.

There are signs of a breakout attempt above 112,000, but it was unsuccessful, leading to a pullback.

Actionable Insights

Consider selling or shorting if the price breaks below the 105,000 support level with confirmation from volume.

Investors may hold if securely above 105,000, watching for any reversal candlestick patterns.

Watch for a confirmation of bearish bias through continued lower lows and lower highs.

The AI Technical Analysis Center is an informational tool only and does not constitute investment or trading advice.
This site is registered on wpml.org as a development site. Switch to a production site key to remove this banner.