Generic selectors
Exact matches only
Search in title
Search in content
Post Type Selectors

Popular stocks

Crypto

CFD

Currencies

Support

Gold

BTC/USD – Technical Analysis – 4h

October 28, 2025 08:04

Quick Summary

The asset is currently experiencing a cautiously optimistic trend.

Recent movements have shown increasing interest from traders.

Key levels are being tested, indicating potential significant market actions.

Candlestick Analysis

The overall trend appears bullish with a series of higher highs and higher lows, particularly evident in the recent upward movement.

There are no clear strong candlestick patterns like bullish engulfing or doji in the immediate timeframe, but there are several smaller bullish candles contributing to the overall upward trend.

A potential breakout level was around 114600, where the price experienced resistance before moving higher. The pullback from this level suggests retesting.

MACD Analysis

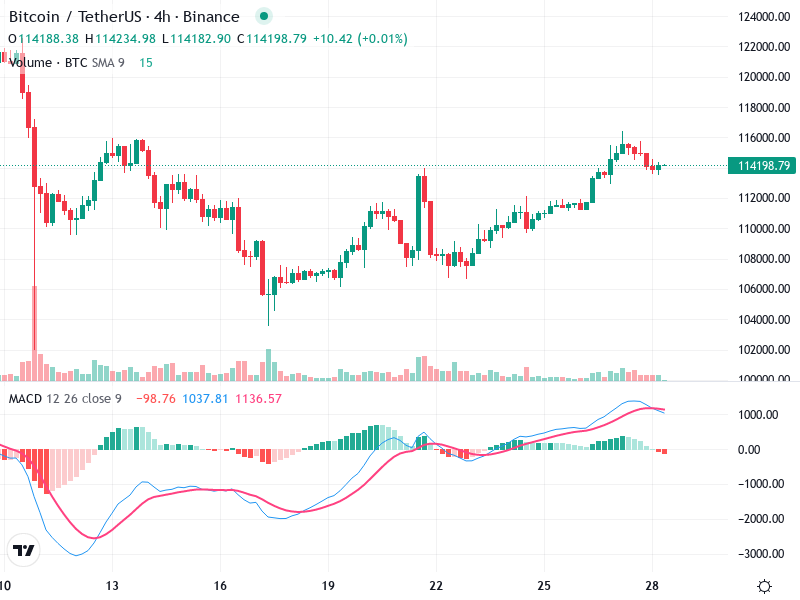
The MACD line is above the Signal line, indicating a bullish crossover earlier in the chart, although the lines are converging slightly, suggesting potential weakening momentum.

Currently showing slight red bars, indicating a possible decrease in bullish momentum but no immediate sign of reversal.

No clear divergences are visible between the MACD and the price action at this point.

Volume Analysis

A noticeable increase in volume occurred during the recent upward move, confirming investor interest and supporting the price increase.

Some volume spikes appear to coincide with price jumps, suggesting institutional or significant trader participation.

The volume trends align with bullish movements and support the ongoing uptrend.

Support & Resistance

Key support level identified around 112000, where the price consolidated before the recent rise.

Immediate resistance around the 116000 level, which the price struggled to break through but managed to slightly surpass.

Testing of these key levels is critical for assessing future price movements.

Actionable Insights

Consider a hold strategy if currently in a position, watching for any further bullish confirmation such as a new high or strong volume supporting upwards momentum.

Look for signs of reversal if the MACD lines cross bearish or if the price breaks below the recent support around 112000.

Monitor the MACD for a bearish crossover and the volume for any drop-off indicating weakening interest.

The AI Technical Analysis Center is an informational tool only and does not constitute investment or trading advice.
This site is registered on wpml.org as a development site. Switch to a production site key to remove this banner.