Generic selectors
Exact matches only
Search in title
Search in content
Post Type Selectors

Popular stocks

Crypto

CFD

Currencies

Support

Gold

BTC/USD – Technical Analysis – 4h

November 7, 2025 08:04

Quick Summary

The latest analysis of the Bitcoin chart reveals a consolidation phase following a significant downtrend, indicating potential indecision in market sentiment. Technical indicators suggest the possibility of a bullish move if certain resistance levels are breached.

With cautious sentiment prevailing, traders should stay vigilant for any potential breakout signals.

Candlestick Analysis

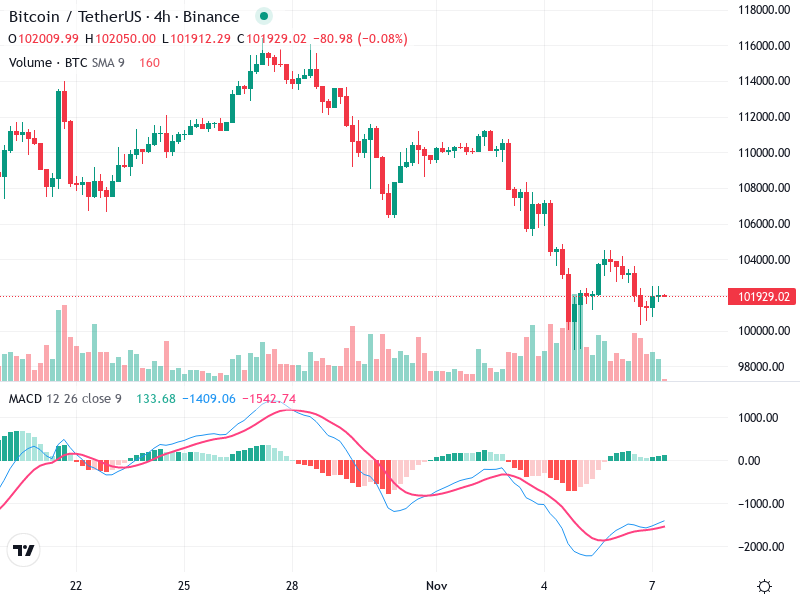
The recent trend has shifted from bearish to possibly sideways, as indicated by the consolidation after a substantial downtrend.

The chart shows some small-bodied candles near the current price, suggesting indecision in the market. No strong bullish or bearish patterns like engulfing or hammer appear at the recent levels.

Around 104,000 is a recent high, indicating a potential breakout zone if surpassed. Conversely, the recent lows near 100,000 serve as a critical pullback or support zone.

MACD Analysis

The MACD line is below the Signal line, but there is a convergence happening which may suggest a potential bullish crossover in the near term.

The histogram is shrinking, indicating that the bearish momentum is weakening.

There is no clear divergence between MACD and price action, suggesting that the recent price movements are largely in line with momentum indicators.

Volume Analysis

The volume has seen slight increases during the sell-off, suggesting strong selling pressure. Recently, volume has normalized, indicating reduced volatility.

Volume spikes were aligned with the bearish move, indicating strong conviction on the sell side. Current volumes do not suggest aggressive buying.

No unusual spikes to suggest significant institutional buying or selling at the moment.

Support & Resistance

Strong support is observed around the 100,000 level, where recent consolidation points to buyer interest.

The 104,000 level acts as immediate resistance, where prior highs may challenge any bullish move.

Overall evidence suggests these levels are crucial for future price action assessment.

Actionable Insights

Consider buying if the price breaks and holds above 104,000 with supporting volume and a bullish MACD crossover.

A break below 100,000 with increased volume could signal a continuation of the downtrend, warranting selling or shorting opportunities.

Monitor for a MACD crossover and see if the price can maintain above 100,000, indicating potential for holding if a base is forming.

The AI Technical Analysis Center is an informational tool only and does not constitute investment or trading advice.
This site is registered on wpml.org as a development site. Switch to a production site key to remove this banner.