Generic selectors
Exact matches only
Search in title
Search in content
Post Type Selectors

Popular stocks

Crypto

CFD

Currencies

Support

Gold

BTC/USD – Technical Analysis – 4h

November 14, 2025 08:05

Quick Summary

The Bitcoin /TetherUS chart currently exhibits a bearish trend with notable price declines. Recent analyses highlight the prevailing downward momentum supported by various indicators.

Traders should exercise caution and monitor key levels and signals for potential changes in trend.

Candlestick Analysis

The chart shows a bearish trend indicated by a series of lower highs and lower lows.

There are no clear bullish reversal patterns like a hammer or bullish engulfing observed in the recent candlesticks.

Some candlesticks show potential indecision (similar to a doji), suggesting possible consolidation or a pause in momentum.

MACD Analysis

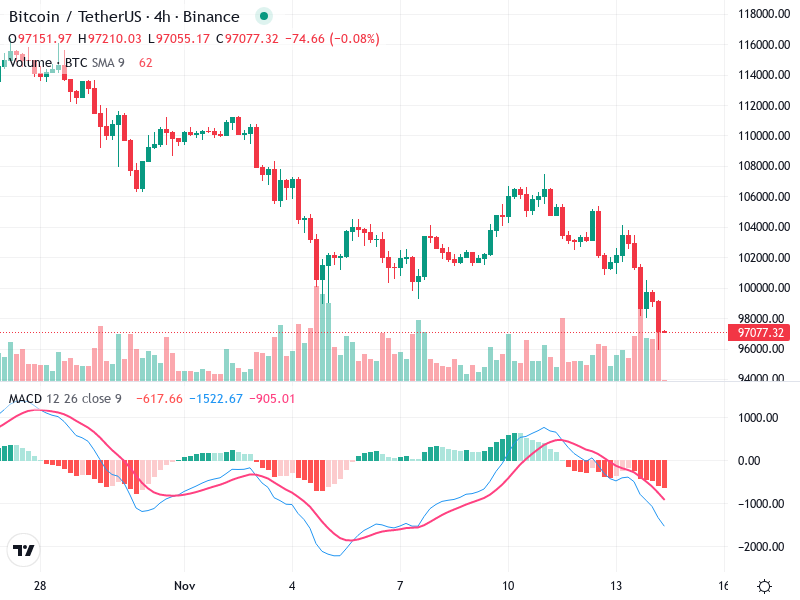
The MACD line is below the Signal line, confirming the bearish momentum with a continuation of the downtrend.

The histogram is also in negative territory and expanding, which indicates strong bearish momentum.

No significant divergence is observed between the MACD indicators and the price action, further supporting the bearish sentiment.

Volume Analysis

Volume is slightly higher during recent down moves, which supports the bearish trend.

The increase in volume on down days suggests strong selling pressure, which confirms the ongoing downtrend.

A notable spike in volume can be seen during recent declines, potentially indicating institutional selling activity.

Support & Resistance

Around 102000 - 104000, previous highs serve as potential resistance if there is an attempt to rebound.

Immediate support is near the recent low around 97000.

A break below this could signal further declines.

Actionable Insights

With the bearish momentum and volume, a continued downtrend is the likely scenario.

Potential short-selling opportunities could be explored below support levels with stop-loss set just above recent highs.

Traders should look for signs of reversal patterns or a bullish crossover in the MACD as a potential indication of a trend change.

The AI Technical Analysis Center is an informational tool only and does not constitute investment or trading advice.
This site is registered on wpml.org as a development site. Switch to a production site key to remove this banner.