Generic selectors
Exact matches only
Search in title
Search in content
Post Type Selectors

Popular stocks

Crypto

CFD

Currencies

Support

Gold

BTC/USD – Technical Analysis – 4h

November 20, 2025 08:04

Quick Summary

This technical analysis explores the current market conditions of Bitcoin /TetherUS. Recent chart patterns suggest a potential shift in sentiment. Key levels are being tested, offering insights into future price movements.

Candlestick Analysis

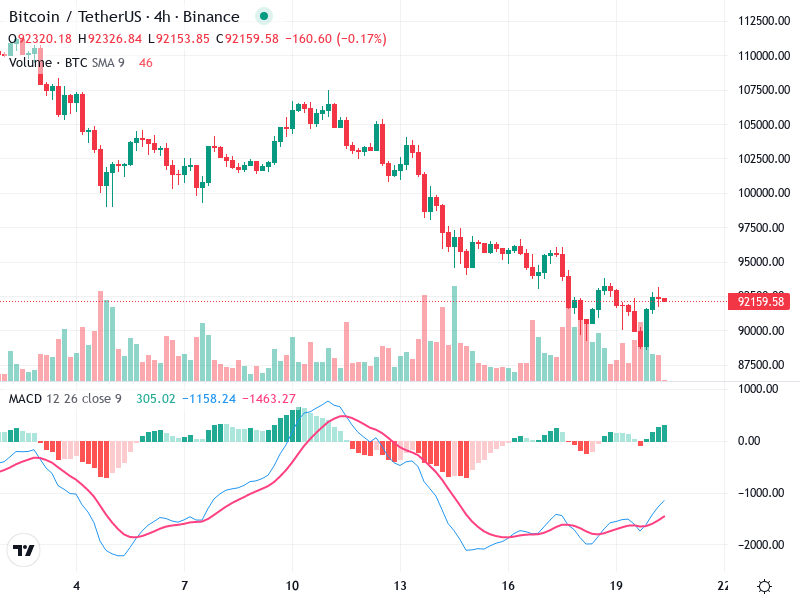
The recent candlestick patterns show a slight recovery from a clear downtrend, with some consolidation indicating possible stabilization.

There are smaller-bodied candles indicating indecision, often associated with doji patterns.

Recently, there are larger-bodied green candles suggesting a potential bullish effort to reverse the downward trend.

MACD Analysis

The MACD line is close to crossing above the Signal line, which is often an early indication of a bullish reversal.

The MACD histogram has shifted from negative to positive, indicating increasing bullish momentum.

No significant divergence is detected between the MACD and price action at this stage.

Volume Analysis

There is an observable increase in trading volume corresponding with the recent bounce, suggesting buying interest.

The volume spikes coincide with the larger green candlesticks, reinforcing the current bullish action.

The significant volume increase during the recent up-movement may suggest some level of institutional activity entering the market.

Support & Resistance

Resistance: Around 92150 to 92326, as indicated by recent price action struggles to close above this range.

Support: The key support level is currently around 90000, below which further bearish pressure might ensue.

The price seems to be testing a minor resistance zone around the 92150 - 92326 range.

Actionable Insights

Consider entering if the price breaks convincingly above the resistance with increased volume.

Watch for any rejection at current resistance levels or break below 90000 as a sell signal.

If already in position, holding may be viable unless major bearish signals emerge.

The AI Technical Analysis Center is an informational tool only and does not constitute investment or trading advice.
This site is registered on wpml.org as a development site. Switch to a production site key to remove this banner.