Generic selectors
Exact matches only
Search in title
Search in content
Post Type Selectors

Popular stocks

Crypto

CFD

Currencies

Support

Gold

BTC/USD – Technical Analysis – 4h

December 1, 2025 08:04

Quick Summary

The chart shows a pronounced decline, with significant bearish indicators. The market sentiment suggests a cautious approach is needed as the potential for further volatility remains high.

Key support and resistance levels have shifted, with previous supports now acting as resistances, indicating a potential shift in overall market direction.

Candlestick Analysis

The chart displays a sharp bearish candlestick with a long body, indicating strong selling pressure.

There is a potential bearish engulfing pattern formed, suggesting a reversal from the previous upward trend.

The recent price action shows a bearish trend as indicated by the long red candle.

MACD Analysis

The MACD line is below the Signal line, confirming a bearish crossover which is a negative signal.

The histogram shows increasing red bars, indicating strengthening bearish momentum.

No significant divergence is visible between MACD lines and price action, as both confirm the downtrend.

Volume Analysis

There is a notable spike in volume accompanying the bearish candle, suggesting the move is supported by strong market participation.

The increase in volume supports the downward price movement, reinforcing the bearish sentiment.

The volume spike may indicate institutional selling or a strong shift in market sentiment.

Support & Resistance

The recent drop has breached the support at approximately 87,500.

A new support level may form around 85,000, but this needs confirmation.

The previous level around 90,000 now acts as resistance.

Actionable Insights

Given the bearish signals, a sell strategy might be appropriate for traders already holding positions.

Those looking to buy should wait for confirmation of support or a bullish reversal pattern.

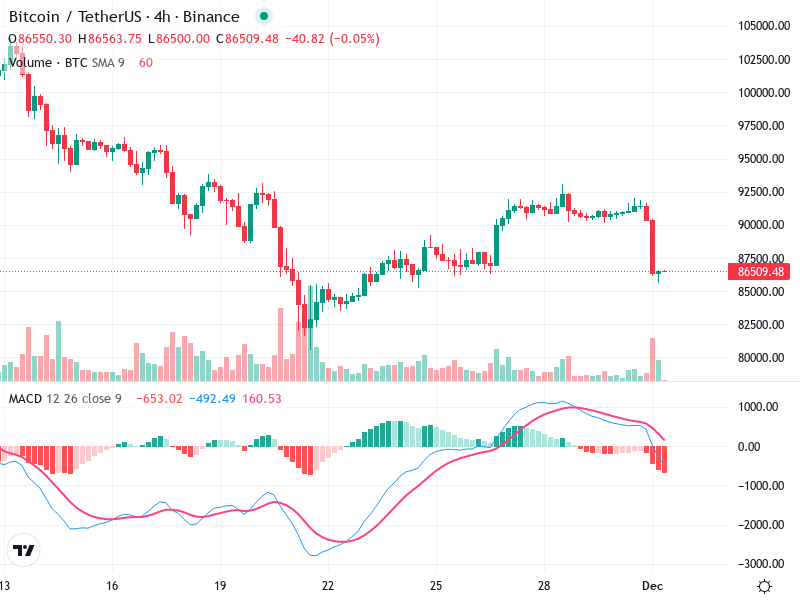
Monitor if the price can sustain below the 87,500 level and look for further confirmation of bearish continuation or a reversal signal near the potential new support at 85,000.

The AI Technical Analysis Center is an informational tool only and does not constitute investment or trading advice.
This site is registered on wpml.org as a development site. Switch to a production site key to remove this banner.