Generic selectors
Exact matches only
Search in title
Search in content
Post Type Selectors

Popular stocks

Crypto

CFD

Currencies

Support

Gold

BTC/USD – Technical Analysis – 4h

December 2, 2025 08:04

Quick Summary

The market asset recently displayed strong bearish indicators, with significant sell-offs. However, there are initial signs of a potential reversal, with some bullish corrections being observed. Traders should keep an eye on key levels for confirming trends.

Candlestick Analysis

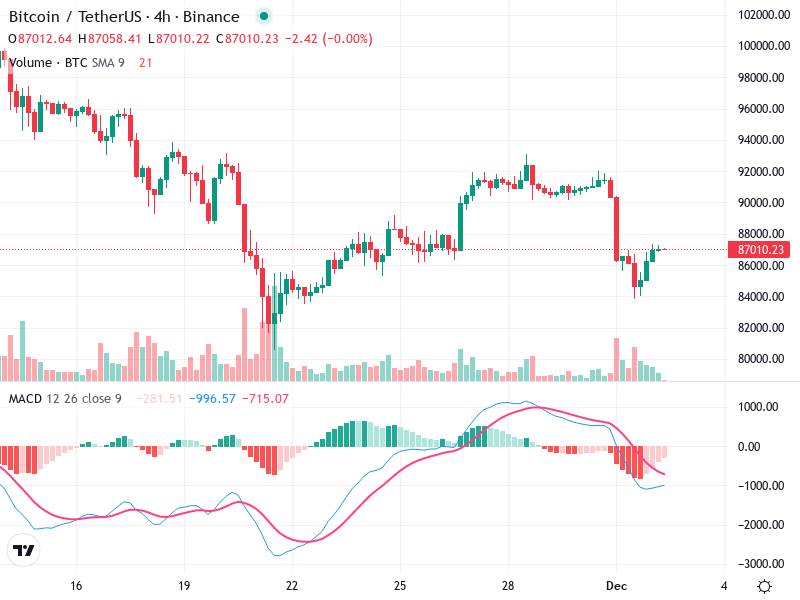
A large bearish candle was seen, followed by a smaller bullish correction, indicating a potential short-term reversal attempt.

There are no strong candlestick reversal patterns like bullish engulfing or hammer, suggesting a developing base for support.

The overall trend on the 4-hour chart remains bearish, with recent downward momentum, but a minor upward correction can be noted.

MACD Analysis

The MACD line is under the Signal line, indicating a bearish crossover with bearish momentum in the market.

The MACD histogram is negative but shrinking, hinting at decreasing bearish momentum and potential stabilization.

No clear divergences are evident; the price and MACD seem aligned concerning momentum.

Volume Analysis

Volume has notably increased with the recent downward price movements, supporting a bearish breakdown.

The high volume indicates strong selling pressure, reinforcing the recent downtrend's validity.

Traders should watch for any volume shifts that might support a reversal.

Support & Resistance

An immediate support is forming around the 86,000 level, with the price rebounding from there.

Breaking 88,000 resistance is critical for a bullish outlook, as it remains a significant level of concern.

Market participants should observe price behavior around these levels for guidance.

Actionable Insights

Consider buying only if price breaks above 88,000 with strong volume, signaling a potential upward trend.

Opportunities for selling arise if the price cannot sustain above 87,000, especially with increasing volume.

Traders should monitor for a potential double-bottom pattern or strong reversal signals at current levels.

The AI Technical Analysis Center is an informational tool only and does not constitute investment or trading advice.
This site is registered on wpml.org as a development site. Switch to a production site key to remove this banner.