Generic selectors
Exact matches only
Search in title
Search in content
Post Type Selectors

Popular stocks

Crypto

CFD

Currencies

Support

Gold

BTC/USD – Technical Analysis – 4h

December 9, 2025 08:04

Quick Summary

The 4-hour chart of Bitcoin /TetherUS reveals a largely sideways movement with occasional bullish and bearish swings.

Recent price action indicates consolidation around the 90,500 level, with critical areas marked for potential breakouts or pullbacks.

Overall, traders should be vigilant, looking for a price breakout signal accompanied by volume and MACD confirmations.

Candlestick Analysis

There was a bullish engulfing pattern visible towards the left side of the chart, suggesting a reversal from a prior downtrend.

A doji pattern near the recent candlesticks indicates market indecision, often a precursor to a change in trend.

The chart shows a sideways trend with some short-term bullish and bearish movements. Recent candles indicate consolidation around the 90,500 level.

MACD Analysis

Currently, the MACD line is close to a bearish crossover with the Signal line. However, the lines are converging, hinting at potential changes.

The MACD histogram is showing diminishing negative values, indicating a reduction in bearish momentum.

There is no significant divergence observed between MACD and price action, suggesting the current readings are aligned with recent price consolidation.

Volume Analysis

There was an increase in volume coinciding with major price movements, reinforcing these price changes.

Recent volumes are subdued, aligning with price consolidation, suggesting neither bulls nor bears have a decisive edge.

A noticeable spike in volume occurred just before the price dip towards the end of the month, possibly indicating institutional selling.

Support & Resistance

Key support around 88,000, evident from a recent price bounce.

Strong resistance around 92,000, marking a level where price previously reversed.

Breaking above resistance could signal the start of a new uptrend, while a drop below support might lead to further declines.

Actionable Insights

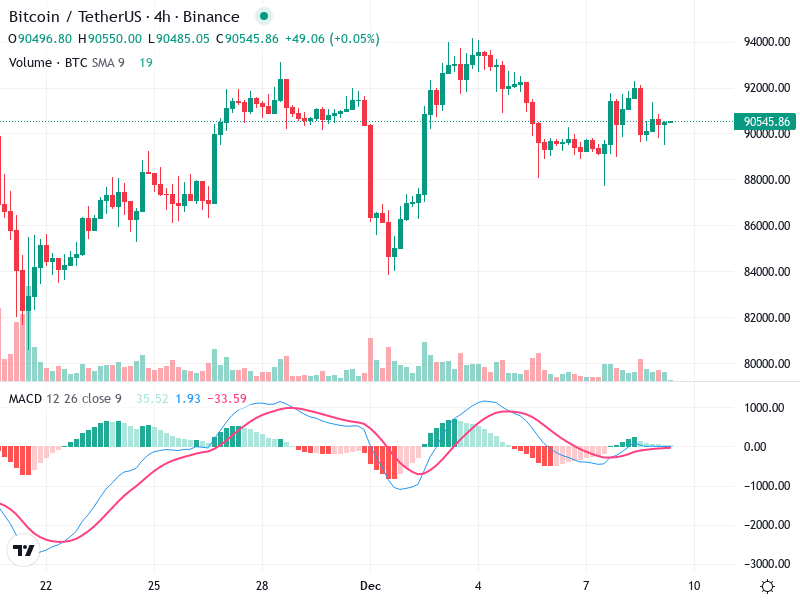
Consider buying on a confirmed breakout above 92,000, supported by increased volume and a bullish MACD crossover.

Consider selling if the price breaks below 88,000 with a bearish volume increase and a confirmed MACD crossover.

If price remains within the 88,000 to 92,000 range, holding might be prudent. Look for additional indications of a breakout.

The AI Technical Analysis Center is an informational tool only and does not constitute investment or trading advice.
This site is registered on wpml.org as a development site. Switch to a production site key to remove this banner.