Generic selectors
Exact matches only
Search in title
Search in content
Post Type Selectors

Popular stocks

Crypto

CFD

Currencies

Support

Gold

BTC/USD – Technical Analysis – 4h

December 24, 2025 08:04

Quick Summary

The asset’s chart currently exhibits a sideways trend with slight bearish tendencies. Recent technical indicators suggest a potential shift in direction is imminent. Investors should closely monitor key support and resistance levels for possible breakout scenarios.

Candlestick Analysis

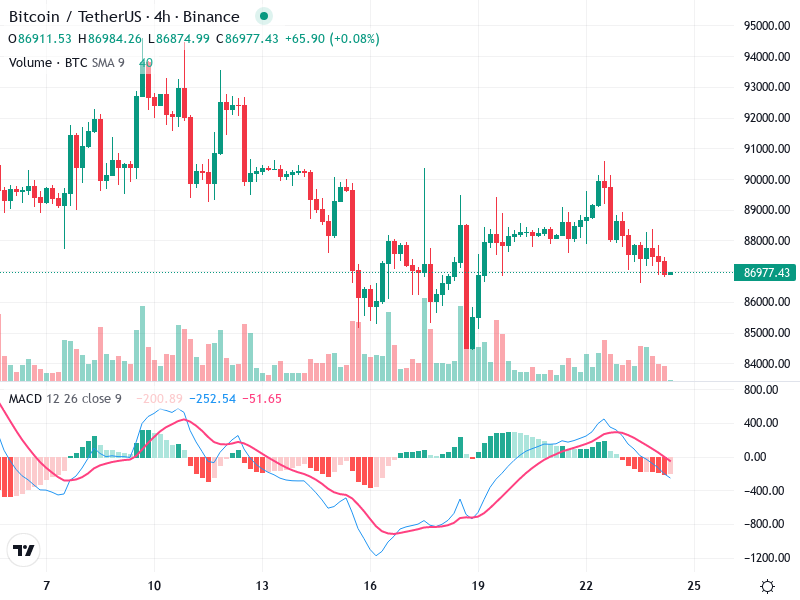
A notable bearish engulfing pattern was observed around the 18th, signaling a potential reversal to the downside.

Several doji candlesticks indicate market indecision, contributing to the overall cautious sentiment.

Key breakout levels are identified around 89,500, with potential pullback support at 86,000, marking crucial zones to watch.

MACD Analysis

The MACD line has crossed below the Signal line, evidencing a bearish crossover.

The histogram remains mostly negative, highlighting a lack of momentum in upward movements.

No significant divergence is noted, as MACD movements align with price actions, confirming current trends.

Volume Analysis

A noticeable spike in volume coincided with the bearish engulfing pattern, suggesting strong selling pressure.

The recent volume increase during the downturn supports the prevailing bearish sentiment.

Unusual volume spikes are linked with large sell-offs, possibly indicating institutional activity.

Support & Resistance

Resistance is identified near 89,500, serving as a potential barrier for upward movements.

Support levels are established around 86,000, acting as a buffer against further declines.

Breaching these levels with significant volume could confirm potential breakouts or breakdowns.

Actionable Insights

Consider short positions if the price falls below 86,000, supported by confirming volume.

If currently holding positions, vigilant monitoring near support levels for defensive action is advised.

Watch for confirmation of trend direction; a volume-backed breach of current support or resistance may indicate the next market move.

The AI Technical Analysis Center is an informational tool only and does not constitute investment or trading advice.
This site is registered on wpml.org as a development site. Switch to a production site key to remove this banner.