Generic selectors
Exact matches only
Search in title
Search in content
Post Type Selectors

Popular stocks

Crypto

CFD

Currencies

Support

Gold

BTC/USD – Technical Analysis – 4h

December 31, 2025 08:03

Quick Summary

The chart illustrates the ongoing market dynamics of , highlighting the interaction between price action and technical indicators. Recent activity suggests varied momentum shifts, warranting closer inspection.

Analysis of key indicators provides insights into potential future movements and strategic opportunities for traders.

Candlestick Analysis

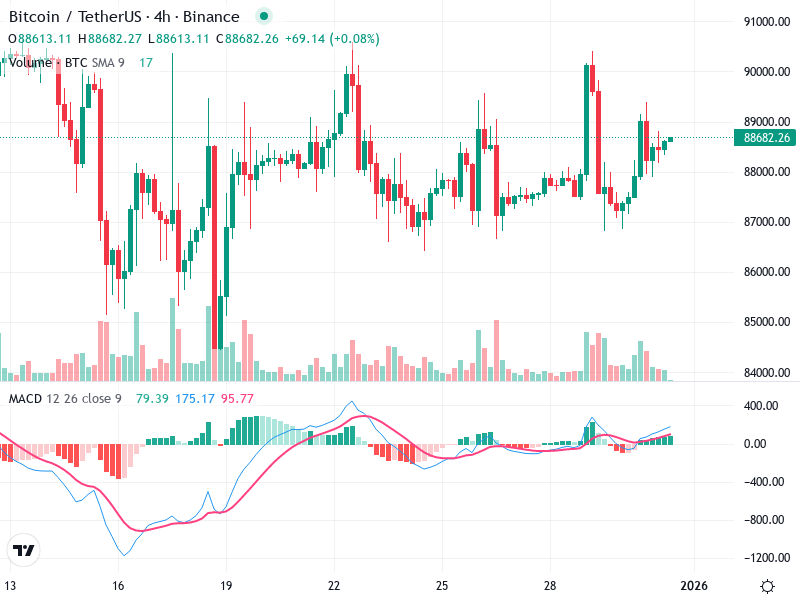
The chart shows a period of consolidation with significant bullish and bearish engulfing patterns, indicating potential for short-term reversals.

The market trend is largely sideways, with periodic bullish and bearish swings lacking clear long-term dominance.

Around 89,000 is a resistance level, with support near 88,000, suggesting attentiveness to breakouts could reveal future momentum.

MACD Analysis

The MACD line crossing above the Signal line hints at emerging bullish momentum.

The positive MACD histogram supports this bullish sentiment, though it's tempered by recently weakening momentum.

No major divergences are apparent, aligning with the current sideways movement in the market.

Volume Analysis

Volume spikes during significant price moves, especially during bearish downturns, indicate heightened selling pressure.

Volume trends generally affirm recent price actions, bolstering the case for trader-backed movements.

Occasional volume spikes suggest possible institutional activity, notably accompanying bearish trends.

Support & Resistance

Resistance is marked around 89,000, while support is found near 88,000.

These levels are vital for spotting potential breakouts or reversals, with a breakout above resistance indicating a possible bullish phase onset.

Continued monitoring of these zones is advised for tactical positioning.

Actionable Insights

Consider buying upon confirmed breakouts above 89,000 with robust volume support.

Be prepared to sell if reversals occur at resistance, particularly with confirming bearish patterns and heightened volume.

A hold strategy may be prudent amid the current sideways trend without clear breakout or breakdown signals.

The AI Technical Analysis Center is an informational tool only and does not constitute investment or trading advice.
This site is registered on wpml.org as a development site. Switch to a production site key to remove this banner.