Generic selectors
Exact matches only
Search in title
Search in content
Post Type Selectors

Popular stocks

Crypto

CFD

Currencies

Support

Gold

BTC/USD – Technical Analysis – 4h

January 6, 2026 08:04

Quick Summary

The chart analysis for Asset shows a significant upward trend, bolstered by recent price movements and technical indicators. Recent activity illustrates a complex interplay of momentum and resistance, making it a potentially favorable asset to watch.

As the market evolves, the chart continues to suggest potential price action scenarios that could guide investment decisions.

Candlestick Analysis

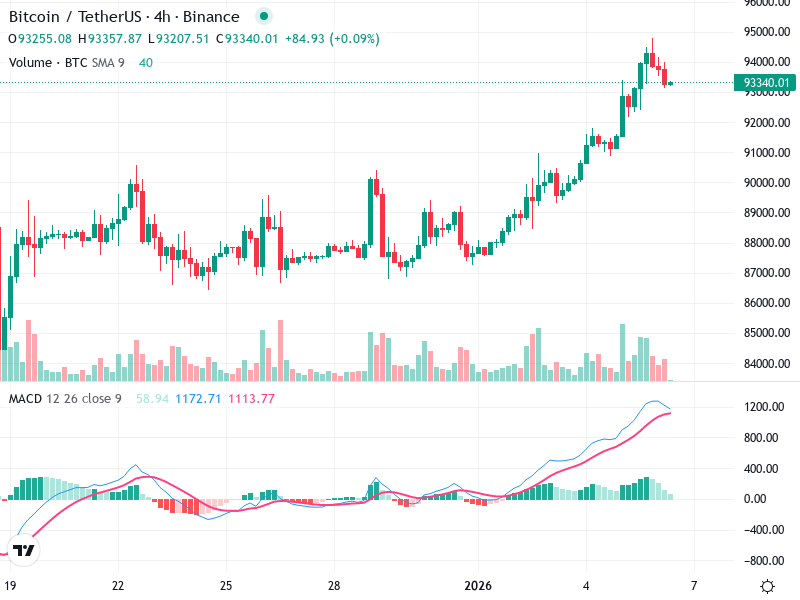
The chart exhibits a bullish trend with higher highs and higher lows, particularly evident in the recent price surge.

A bearish reversal pattern seems to be forming near the top (e.g., a spinning top), which suggests potential indecision amongst traders.

The price recently broke above the previous resistance level around 90,000 with strong momentum but is facing some resistance near the 94,000 level.

MACD Analysis

The MACD line is above the Signal line, indicating a bullish sentiment in the market. However, it shows signs of converging, which may foreshadow a potential weakening of the current trend.

The histogram bars are decreasing in height, suggesting a reduction in bullish momentum.

No clear divergence between MACD and price action has been detected; both are generally aligned, confirming the uptrend.

Volume Analysis

A noticeable volume spike accompanied the recent price increase, supporting the bullish move. However, volume has since tapered off, which could imply reduced buying interest.

The observed volume spike could indicate significant trader or institutional involvement, signaling a potential distribution phase near current levels.

Volume changes need to be monitored to confirm or discredit this trend's validity.

Support & Resistance

Key support is identified around 92,000, where earlier consolidation occurred.

Resistance is evident near 94,000, where recent price action shows sellers stepping in.

Actionable Insights

Consider buying if the price breaks convincingly above 94,000 with increased volume.

Watch for a bearish MACD crossover or a strong candlestick reversal pattern near current levels to consider selling.

Maintain current positions but monitor for reversals at identified resistance levels and volume changes.

The AI Technical Analysis Center is an informational tool only and does not constitute investment or trading advice.
This site is registered on wpml.org as a development site. Switch to a production site key to remove this banner.